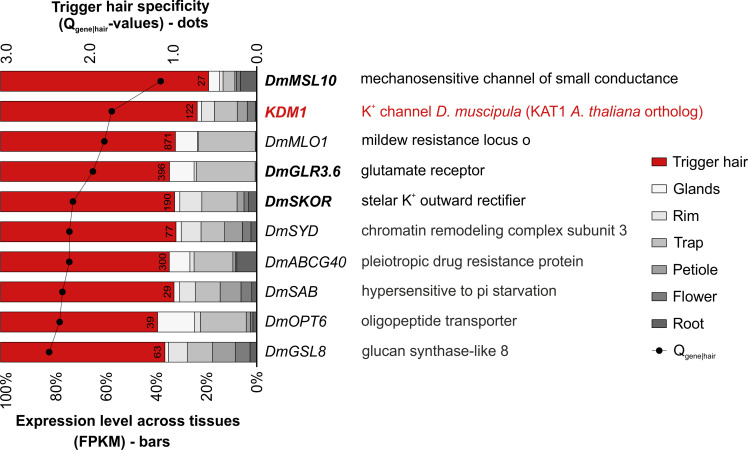
Fig 2. Ion channels are among the most trigger hair–specific genes.
The dots represent the trigger hair Qgene|hair-value calculated by the Shannon entropy method for tissue specificity. A very low Qgene|hair-value indicates high tissue specificity. The stacked bars show the proportion to which each gene is expressed across all investigated tissues. The numbers on the red bars represent the mean FPKM expression values for the trigger hair tissue. The genes marked in bold letters represent ion channels. Shown are the top 10 highly expressed genes (trigger hair FPKM > 20) out of the bona fide trigger hair–specific genes. Genes that passed the Shannon entropy calculated Qgene|hair-value < 3.9 bits, comprising 1% of the total Laplace distribution area, and were at the same time trigger hair up-regulated DEGs at least 2-fold in the trigger hair compared to all the other tissues (log2FC > 1, BH adjusted p-value < 0.001), were considered bona fide trigger hair–specific genes. Underlying full raw dataset is provided in S2 Data. BH, Benjamini–Hochberg; DEG, differentially expressed gene; FPKM, Fragments Per Kilobase of transcript per Million mapped reads.

