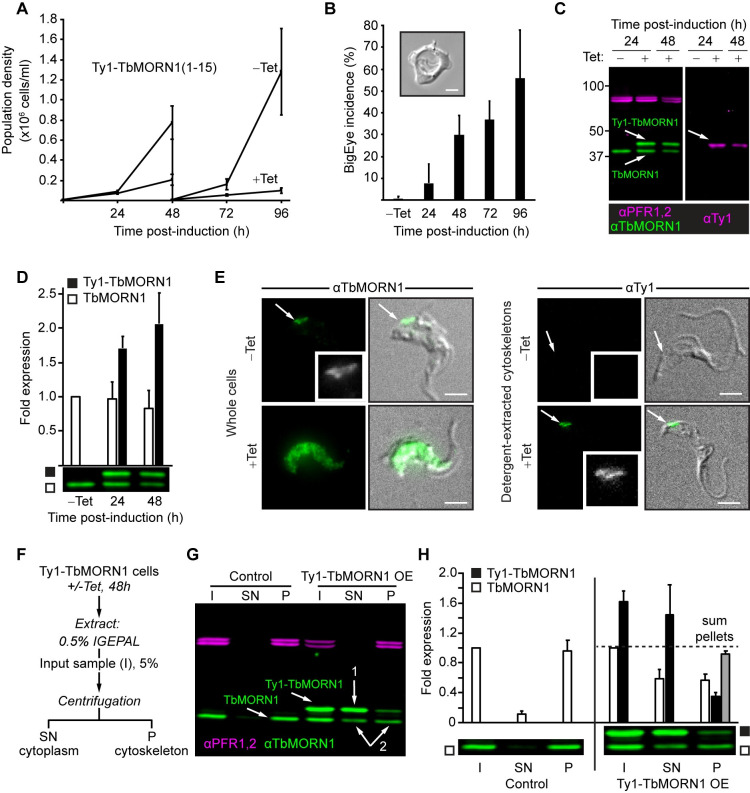
Fig 3. Overexpression of Ty1-tagged TbMORN1 causes a dominant negative phenotype.
(A) Overexpression of Ty1-TbMORN1 is deleterious. Growth curves of control (-Tet) cells, and cells inducibly expressing Ty1-TbMORN1(1–15) (+Tet). Population density was measured every 24h, and the cultures split and reseeded at 48h. Data were compiled from 3 separate clones, each induced in 3 independent experiments; bars show mean +/- SD. (B) Overexpression of Ty1-TbMORN1 produces a BigEye phenotype. The incidence of BigEye cells was counted in control (-Tet) and Ty1-TbMORN1-expressing cells at the indicated timepoints. Data were compiled from 3 separate clones, each induced in 3 independent experiments; bars show mean + SD. The inset shows an example BigEye cell. Scale bar, 2 μm. (C) Tight induction of Ty1-TbMORN1 expression. Whole-cell lysates were harvested from control (-Tet) and Ty1-TbMORN1-expressing cells (+Tet) at the indicated timepoints and probed with anti-TbMORN1 and anti-Ty1 antibodies. PFR1,2 were used as a loading control. At least three independent inductions were carried out for each clone; an exemplary blot is shown. (D) Quantification of overexpression. The levels of endogenous TbMORN1 and ectopic Ty1-TbMORN1 in immunoblots were normalised relative to the PFR1,2 signal. Data were compiled using 3 separate clones, each induced in at least two independent experiments; bars show mean + SD. (E) Ty1-TbMORN1 can localise correctly to the cytoskeleton. Whole cells or detergent-extracted cytoskeletons were fixed and labelled with anti-TbMORN1 or anti-Ty1 antibodies. The fluorescence signal is shown with the transmitted light image of the cell overlaid; inset shows the fluorescence signal from the antibody in greyscale. Results confirmed for 3 separate clones, exemplary images are shown. Scale bars, 2 μm. (F) Schematic of the fractionation protocol. (G) Overexpression of Ty1-TbMORN1 displaces the endogenous protein from the cytoskeleton. Control and Ty1-TbMORN1-expressing cells were fractionated as shown in panel F and the I, SN, and P fractions were blotted. PFR1,2 was used as a marker for the cytoskeleton. Expression of Ty1-TbMORN1 was accompanied by a displacement of endogenous TbMORN1 from the insoluble (P) fraction into the soluble (SN) fraction (arrows 1,2). Equal fractions (5%) were loaded in each lane. 3 independent experiments using 3 separate clones were carried out; an exemplary blot is shown. (H) Quantification of the fractionation data. Bars show mean + SD.

