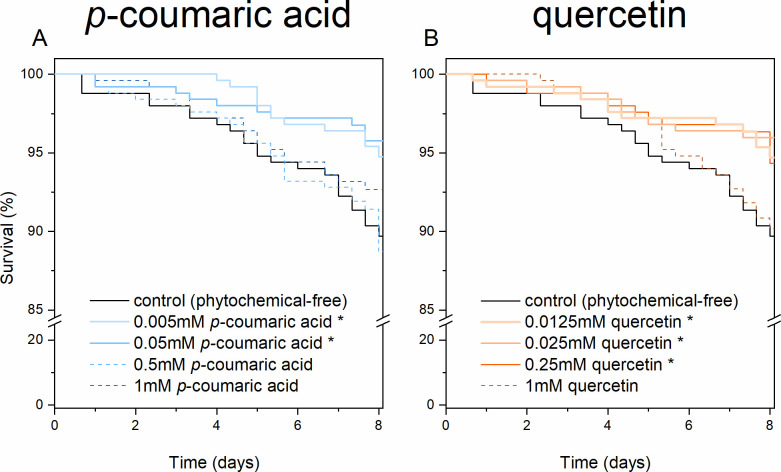
Fig 1. Kaplan–Meier plots of honey bee longevity with dietary amendments at a range of concentrations.
(A) p-coumaric acid and (B) quercetin. (n = 1 250 for each phytochemical group and n = 250 for each phytochemical concentration subgroup, solid line and * = p < 0.05, Tarone-Ware test between the treatment and control).

