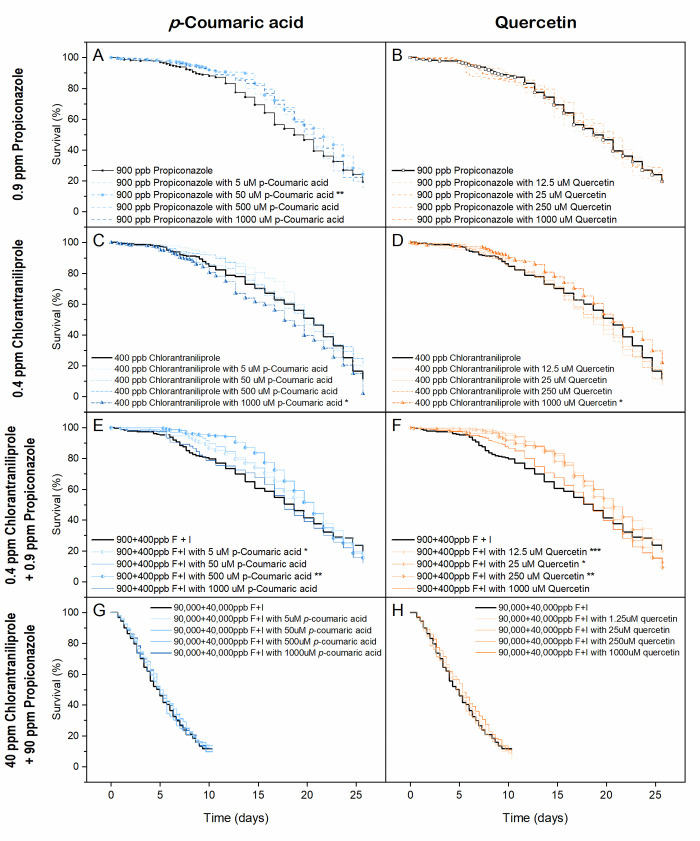
Fig 4. Kaplan–Meier survival curves of honey bees on dietary tank-mix pesticides and phytochemicals.
Diet treatments included: (A) 0.9 ppm propiconazole amendment with p-coumaric acid at a range of concentrations, (B) 0.9 ppm propiconazole amendment with quercetin at a range of concentrations, (C) 0.4 ppm chlorantraniliprole amendment with p-coumaric acid at a range of concentrations, (E) 0.9 ppm propiconazole + 0.4 ppm chlorantraniliprole amendment + p-coumaric acid at a range of concentrations, (F) 0.9 ppm propiconazole + 0.4 ppm chlorantraniliprole amendment + with quercetin at a range of concentrations, (G) 90 ppm propiconazole + 40 ppm chlorantraniliprole amendment with p-coumaric acid at a range of concentrations, and (H) 90 ppm propiconazole + 40 ppm chlorantraniliprole amendment with p-coumaric acid at a range of concentrations (F: fungicide propiconazole, I: insecticide chlorantraniliprole; n = 1 125 for each pesticide group in Fig 4A-4F and n = 1 250 for each pesticide group in Fig 4G and 4H; *** = p < 0.001, ** = p < 0.01, * = p < 0.05, Tarone-Ware test).

