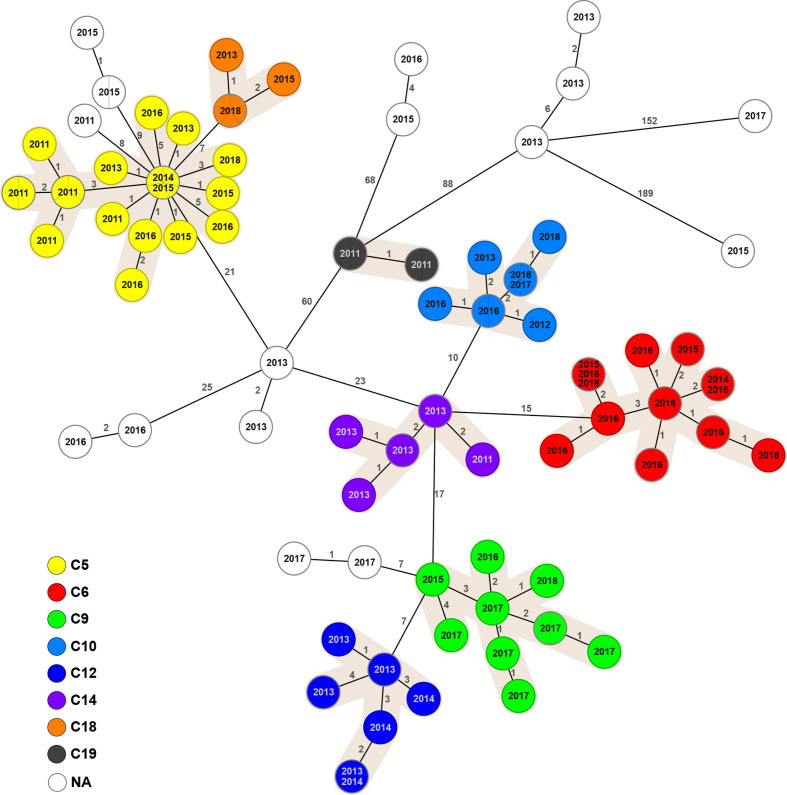
Fig. 4.
MST generated for 123 Italian isolates of B. melitensis in the BAPS 5 population using the gene-by-gene approach. The MST was calculated by pairwise comparison of 2704 target genes with missing values ignored. Node labels correspond to strain isolation year and the branches to the number of discriminating loci. Complexes of genotypes within a distance of six alleles and containing a minimum of five isolates are numbered and depicted with different colours. Two main phylogenetic clusters are highlighted.

