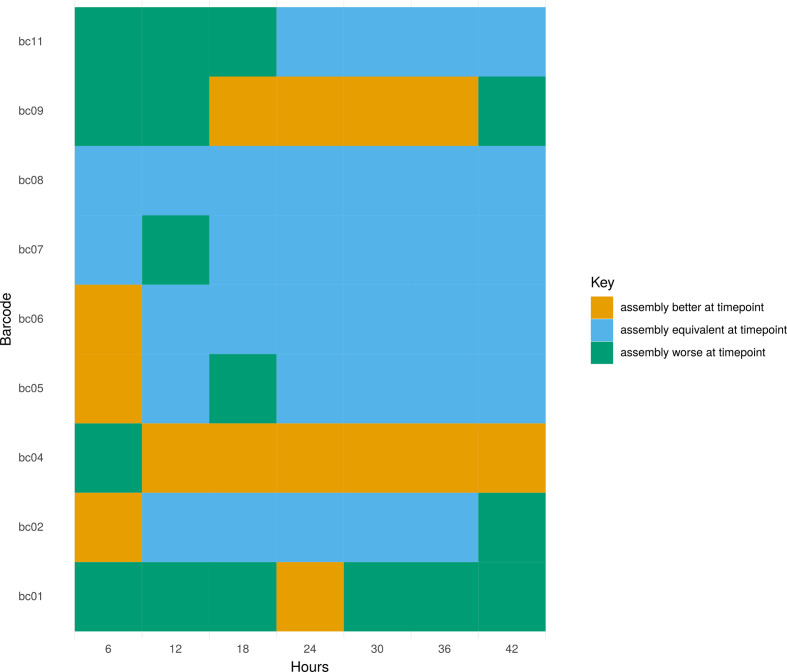
Fig. 3.
Assembly likelihoods were calculated with the assembly likelihood estimator (ALE) by mapping Illumina reads to hybrid assemblies. Likelihoods were calculated for assemblies of each barcoded isolate (y-axis) created at 6 h intervals up to 48 h (x-axis). A likelihood difference of 0 (blue) implies that the assembly at time t is equally as likely as that at t=48 h. A positive likelihood difference (orange) implies that the assembly at time t was better than at 48 h and a negative likelihood difference (green) implies a worse assembly at time t vs 48 h.

