
Fig 1. Bone and vascular structural parameters measured at the right tibia using nanoCT at 3 μm resolution.
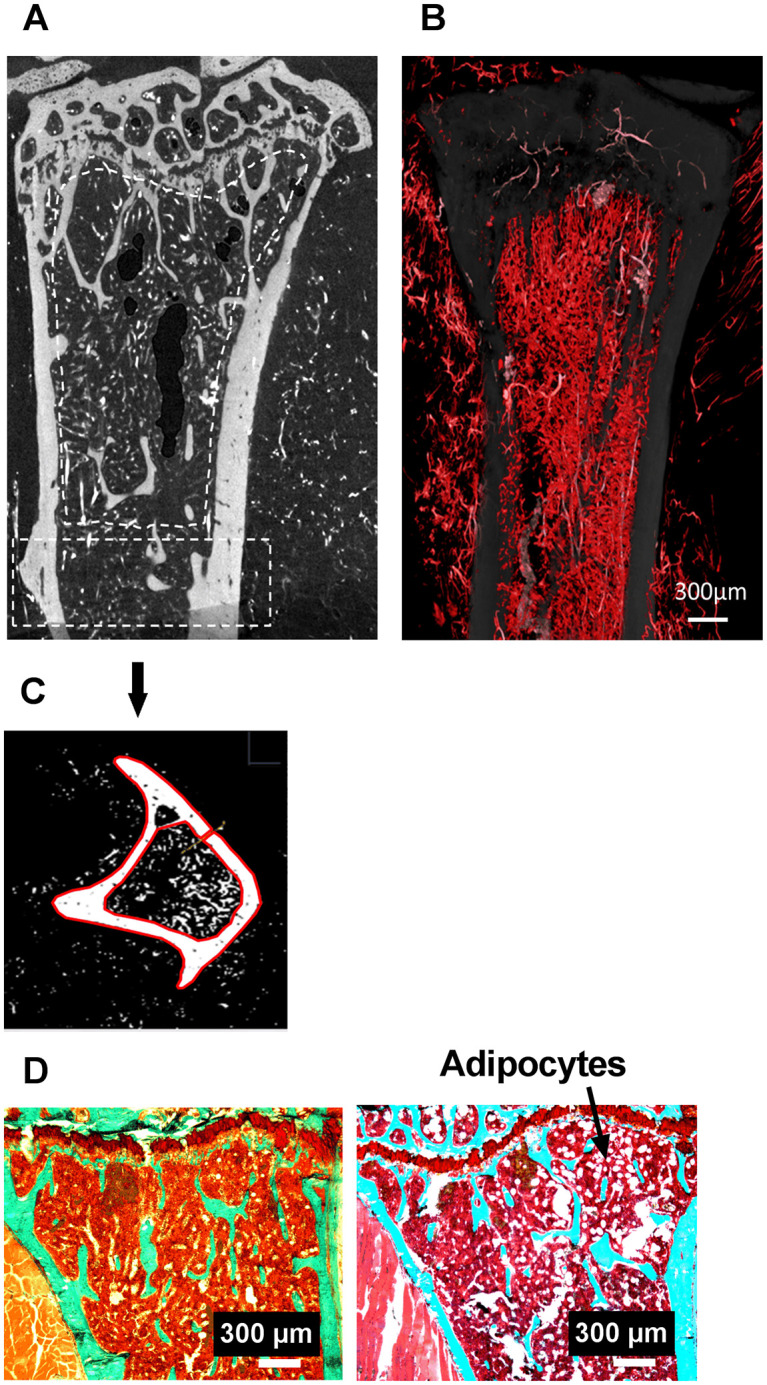
(a) metaphyseal and (c) cortical region of interest (ROI). In (a), blood vessels filled with barium sulfate appear in white, bone in grey. (b) Stack of 46 images, each 3 μm thick, processed in ImageJ with white/red color assignment to pixels corresponding to the vascular sector. (c) Transversal section in the diaphysis, bone and blood vessels appear in white after thresholding, the red contours delimit the cortical bone (d) Tibial metaphysis with a safranin O/Fast Green stain used for the quantification of adipocytes. On the left an image (bar is 500 μm) of the Ctrl 2g group and on the right an image of the OA 2g group.