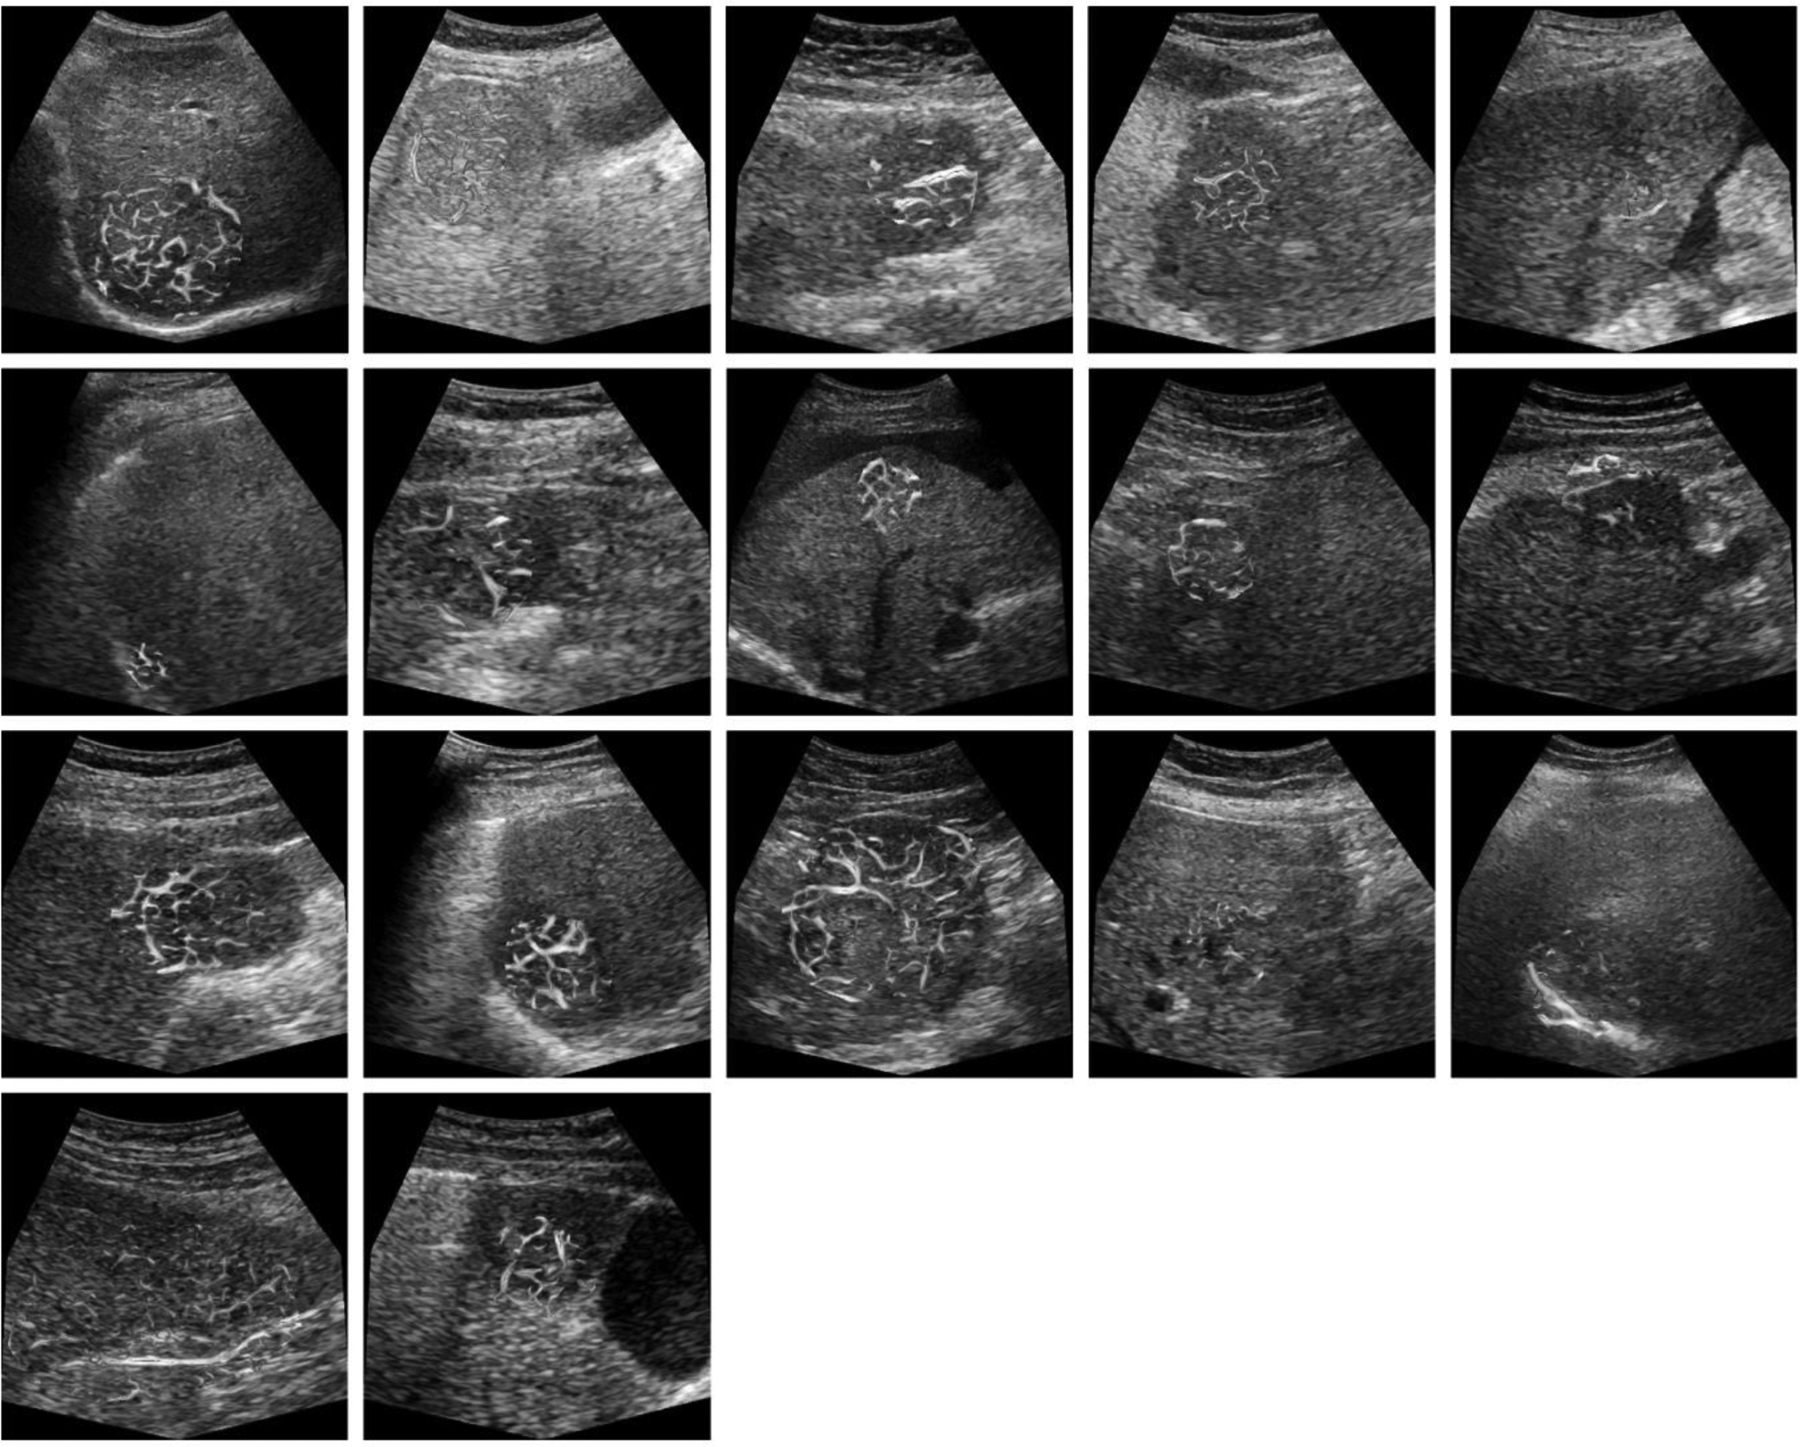
Figure 7:

US images from patients with HCC that exhibited an incomplete response to TACE treatment. Microvascular morphological structures are overlaid on a single B-mode US image. Color indicates the vessel diameter measurements from red (high) to blue (low). Note that tumors are relatively large and have a more chaotic microvascular structure compared to patient tumors that exhibit a complete response to TACE.
