Fig. 4.
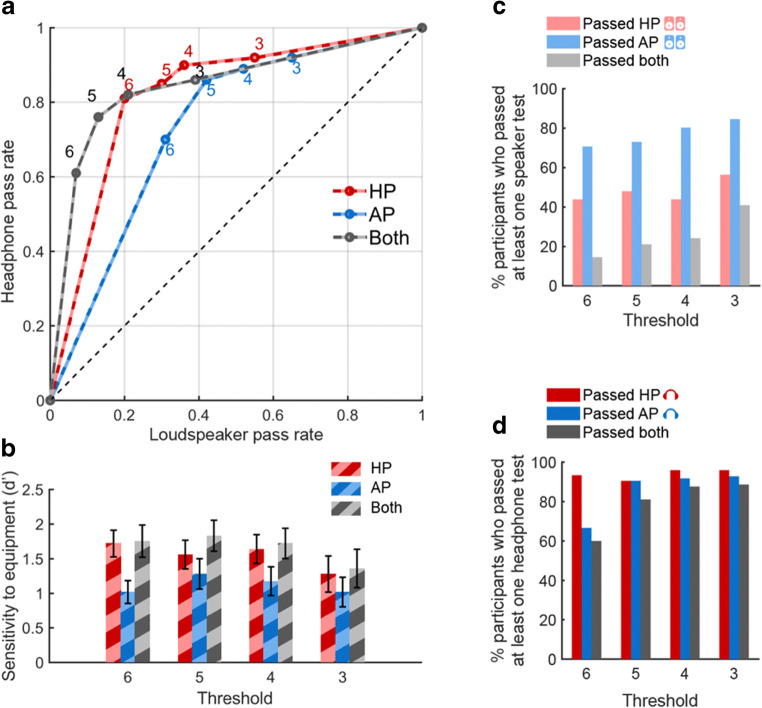
Ability of HP, AP and a combined test (“Both”) to distinguish between headphone and loudspeaker users (N = 100). a ROC curves. The proportion of participants passing at each above-chance threshold (3, 4, 5, 6/6 labeled next to each data point) while using headphones (“hits”, y-axis) or loudspeakers (“false alarms”, x-axis) for HP, AP or a combined test (“Both”). b Sensitivity (d’) at each threshold. Error bar = 1 std bootstrap with 10,000 iterations. c Pass rates with loudspeakers at each threshold, plotted relative to the total number of participants who passed at least one of the loudspeaker tests. d Pass rates with headphones. Whilst a large proportion of participants pass both AP and HP tests over headphones (dark grey bars in d), only a small proportion pass both tests over loudspeakers (light grey bars in c)

