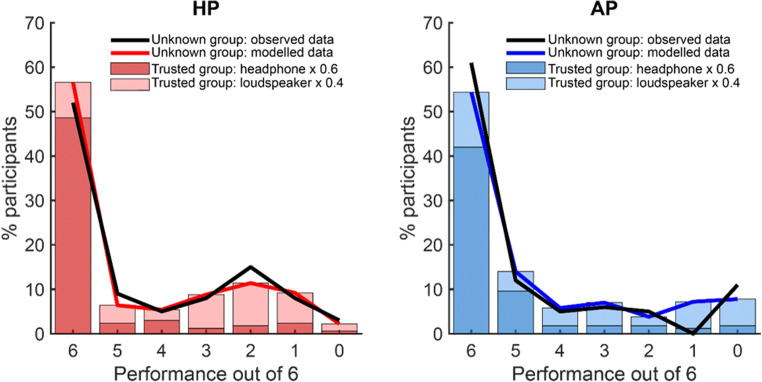
Fig. 5.
Performance in the “Unknown” Group (Experiment 2; N = 100). The black solid line illustrates the performance observed in the “Unknown” group in the HP (left) and AP (right) tests. The red/blue lines and stacked bars illustrate the result of modeling to determine the likely proportion of subjects in the “Unknown” group who actually used headphones. The stacked bars indicate the product of the proportion of participants in the “Trusted” group at each performance level with the relevant coefficient from the best-fitting model (0.6 for headphones and 0.4 for loudspeakers, fixed across HP and AP). The distribution of observed performance in the “Unknown” group matched the modeled data well for both HP and AP tests. This indicates that only roughly 60% of participants in the “Unknown” group showed performance that was consistent with headphone use

