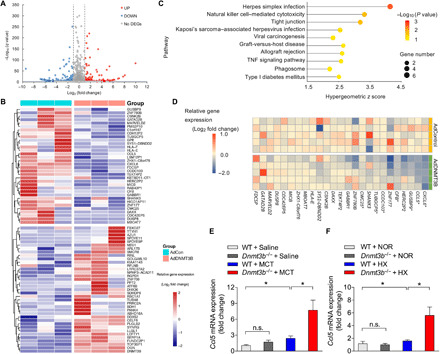
Fig. 6. Mechanism of protective role of Dnmt3b in vascular remodeling in PAH.

(A) Volcano plot of DEGs in hPASMCs infected with AdDNMT3B (MOI = 20) versus AdControl indicating up-regulated genes, which are highlighted in red, and down-regulated genes, which are highlighted in green. The thresholds are shown as dashed lines (horizontal: q < 0.001; vertical: absolute log2 FC ≥ 1). (B) Heatmap illustrating DEGs for hierarchical clustering. (C) KEGG pathway enrichment analysis of the identified DEGs between AdDNMT3B and AdControl groups. The 10 most significantly enriched pathways (P < 0.05 by Fisher’s exact test) are shown. TNF, tumor necrosis factor. (D) mRNA expression of selected down-regulated genes out of RNA-seq data was analyzed by RT-PCR. The relative FC, compared with those from AdControl-infected hPASMCs, was log-transformed at the base of 2 and shown in the heatmap. *P < 0.05 versus AdControl-infected hPASMCs, Student’s t test, n = 5 per group. (E and F) RT-PCR analysis of expression of Ccl5 in lungs of WT and Dnmt3b−/− PH rats after MCT injection (E) or under hypobaric hypoxic conditions (F), demonstrating a higher Ccl5 expression in Dnmt3b−/− PH rats (n = 4 to 8 per group). *P < 0.05 versus WT control group or WT MCT or WT hypoxia group as indicated, one-way ANOVA with Bonferroni correction for multiple comparisons; mean ± SEM.
