
Fig. 1. Evaluation of circulating lymphocyte and monocyte subpopulations in select healthy controls (N = 15), acute influenza-infected subjects (N = 23), and acute SARS-CoV-2–infected subjects (N = 22).
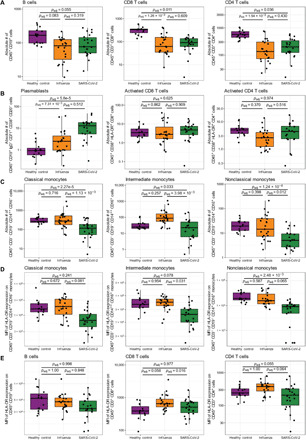
Absolute numbers of (A) B cells, CD8+ T cells, and CD4+ T cells; (B) circulating B cell plasmablasts, activated CD8+ T cells, and activated CD4+ T cells; and (C) classical, intermediate, and nonclassical monocytes were quantified by flow cytometry. Surface expression of the major histocompatibility complex class 2 molecule, HLA-DR, on the surface of the indicated subpopulations of circulating monocytes (D) and lymphocytes (E) as measured by geometric mean fluorescence intensity (MFI) using flow cytometry. Presented P values are from pairwise comparisons of estimated marginal means of linear regression models that adjust for ethnicity, sex, age, and all comorbidities (immunocompromised, end-stage renal disease, chronic lung disease, chronic heart failure, and diabetes mellitus). P values were adjusted for multiple comparisons using Tukey’s method. For comparisons between COVID-19 and influenza, the models also include days of symptom duration at study enrollment as a covariate. In each case, raw values are plotted on the log10 scale.