
Fig. 2. Selective cytokine up-regulation in patients with COVID-19 from the primary cohort.
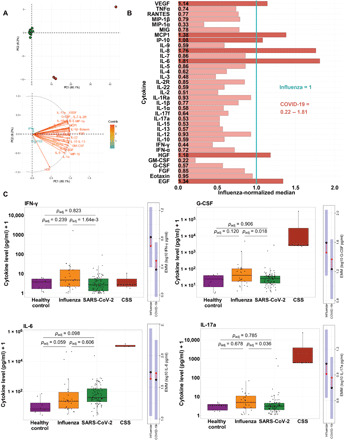
(A) Top: PCA of 35 cytokines measured in COVID-19 subjects from the primary cohort. Red circles: patients with CSS; green dots: all other subjects. Samples with missing cytokine data were excluded. Bottom: corresponding PCA loadings indicating effects of each cytokine. (B) Relative cytokine abundance plot, with each cytokine normalized to the respective median cytokine level in influenza subjects. The normalized median cytokine level in influenza patients (1.0) is represented by the vertical blue line. Bar graphs represent the normalized median COVID-19 cytokine level relative to the normalized median influenza cytokine level. Light red bars: cytokine levels lower in COVID-19 than influenza patients (normalized median < 1, n = 28); dark red bars: cytokines levels greater in patients with COVID-19 than in patients with influenza (normalized median > 1, n = 7). (C) Box plots show cytokine concentrations in healthy, influenza, COVID-19, and CSS subjects, with raw values plotted on the log10 scale. P values are from estimated marginal means (EMM) comparisons, averaging over all demographic and clinical factors included as covariates and adjusted for multiple comparisons. To the right of each box plot are EMM plots for the influenza–COVID-19 comparison. Black dot: estimated marginal mean for the log10 concentration of the cytokine, averaged over the levels of all other covariates; blue shading: corresponding 95% confidence interval; red arrows: SE in one direction, with overlapping SE arrows indicating no significant difference between the EMM of a given cytokine in influenza subjects versus COVID-19 subjects.