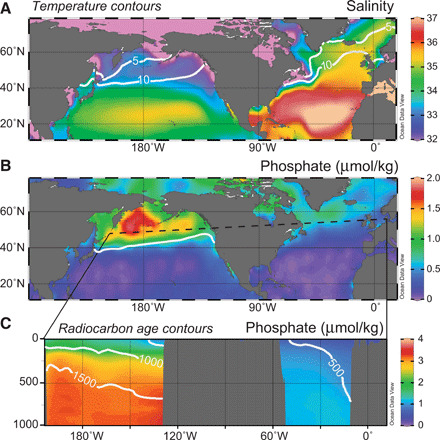
Fig. 1. Modern hydrography and nutrient content of the northern Pacific and Atlantic Oceans.

(A) Sea surface salinity, with sea surface temperature contours for 5° and 10 °C. (B) Surface phosphate concentration, with a sea surface height contour to denote the subpolar gyre boundary. (C) Subsurface phosphate concentration along a zonal section indicated by the dashed line in (B), with pre-bomb radiocarbon age contours. Note the relative isolation of the subpolar gyre in the North Pacific, which allows pooling of cold, fresh water in the surface, and old, nutrient-rich waters to upwell from below. In contrast, the active overturning circulation of the North Atlantic flushes warm, salty, nutrient-poor water from the subtropics through the upper reaches of this well-ventilated basin. Salinity, temperature, and phosphate data are gridded annual averages from WOA09; radiocarbon data from Global Ocean Data Analysis Project version 2 [GLODAPv2 (101)]; and sea surface height from (159).
