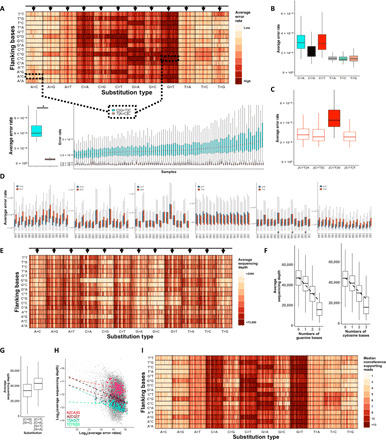
Fig. 2. Error rates significantly differ between trinucleotide sequence contexts.

(A) Nonreference average error rates at the 192 distinct trinucleotide contexts are shown using the AML-MRD dataset. Vertical lines in each box represent individual samples. Samples’ order is kept among distinct contexts. Arrows represent a group of samples with high error rates across multiple contexts. The bottom panels exemplified variation among contextual error rates (*Wilcoxon signed-rank test: P < 1.8 × 10⁻¹⁷) and samples (Mann-Whitney test, samples with the highest and lowest error rates. C[G>T]C: P < 7.7 × 10−41, T[A>C]C: P < 3.6 × 10⁻⁶). (B). C>T and C>A substitutions are more frequent (Wilcoxon signed-rank test, P < 1.4 × 10−252 for all the comparisons with the other substitution types). (C) High error rates at CpG sites (Wilcoxon signed-rank test, P < 1.1 × 10−64 for all comparisons). (D) Error rates vary between error contexts and their reciprocals (Wilcoxon rank sum test, P < 0.05; #significance was not reached). (E) Average sequencing depths. Arrows represent a group of samples with low sequencing depths across multiple contexts. (F) Reduced sequencing depth at contexts that include reference cytosine and an increasing number of guanine (Pearson correlation: r = −0.35; P = 2.3 × 10−264) and at contexts that include reference guanine with an increasing number of cytosine (r = −0.29; P = 8.6 × 10−179). (G) Low sequencing depth at contexts with C>G or G>C base substitutions (Wilcoxon signed-rank test: P = 1.7 × 10−217). (H) Inverse correlation between depth and error rates (black dashed line, log-log scaled Pearson correlation: r = −0.27; P = 9.7 × 10−308). Correlation strengths differ among different error contexts (colored dashed lines). (I) The number of nonreference supporting reads at the 192 distinct trinucleotide contexts is shown. The samples’ order is identical across (A), (E), and (I).
