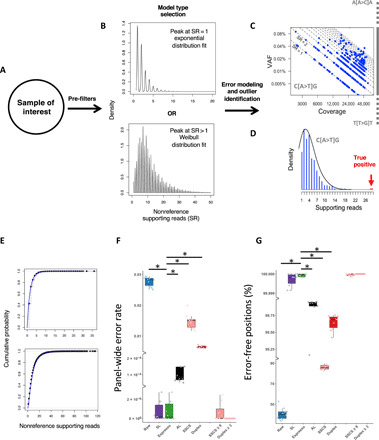
Fig. 3. Integration of intra-sample contextual error modeling for error suppression.

Flowchart illustrating the error modeling technique that is implemented by Espresso. (A) Following the summarization of the sequencing data to include the dominant alleles at each investigated genomic position, their corresponding read counts, and the average mapping read qualities in each sample of interest, a set of filters is being applied, aiming to deplete potential somatic SNVs and common polymorphism from being included in the error models. (B) On the basis of the distribution of the nonreference supporting reads in the enriched error list, Espresso selects between either the exponential or the Weibull probabilistic approaches. (C) The nonreference supporting read (SR) counts in each sample are being grouped based on the genomic sequence context to generate 192 context-specific distribution models. (D) The models are being reapplied to the entire sample’s data for outlier identification. True positives are being determined if they reach statistical significance when compared to their corresponding error distribution. (E) The cumulative distribution function graph displays the empirical data (black dots) and the theoretical data (blue line) generated by the 192 models in all the samples included in the CB dataset (top, exponential models) and the AML-MRD dataset (bottom, Weibull models). (F) Panel-wide error rates defined as the number of nonreference alleles supporting reads following error suppression, divided by all the reads from the same category (i.e., raw, SSCS, and duplex reads) across the entire 1,264,830-bp panel and (G) percentage of error-free positions in the 10 cord blood samples are illustrated. For error suppression, a cutoff P value ≤ 0.05 (Bonferroni-adjusted) was used. SSCS and duplex cutoffs are ≥1 nonreference supporting read unless indicated otherwise. * indicates Wilcoxon signed-rank test: P < 0.002.
