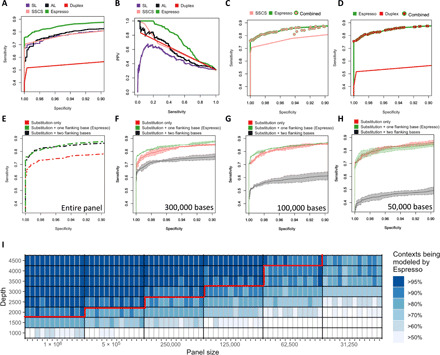
Fig. 4. Statistical measures of performance and constraints of contextual error modeling.

(A) Espresso demonstrates improved sensitivity versus specificity and (B) preferable precision-recall trade-offs as compared with the various indicated methods. The ability of each method to differentiate between 119 positive alleles and 186 negative control variants in a set of serially diluted cell line DNA samples was tested. (C and D) No substantial benefit of using UMIs to augment Espresso’s performance could be determined. Sensitivities and specificities were measured at all the possible combinations of the unique P values outputted by Espresso and the unique numbers of SSCS or duplex nonreference supporting reads that were observed in the dataset. The maximum sensitivities at each calculated value of specificity are illustrated. (E to H) Sensitivity versus specificity trade-offs derived by the reduced and extended contextual error modeling approaches are illustrated in comparison with Espresso. Ninety-five percent confidence intervals (shaded colors) and average values were derived by three random subsets of the data for each one of the indicated in silico decreased panel sizes. (I) Heatmap illustrating the percentage of contextual models that can be generated by Espresso when data are being restricted by either panel size reduction or sequencing depth reduction, or both. Data removal was controlled for both the reference and nonreference supporting reads, thus keeping the variant allele frequencies of the nonreference alleles similar to those in the original samples. The red line illustrates such combinations, of which 90% or more of the distinct contextual models could have been generated in every sample in the CL dataset. With datasets that fall below this line, the 12-model contextual error modeling approach can be used in addition to Espresso.
