
Fig. 6. AML transformation risk prediction using recurrently mutated loci.
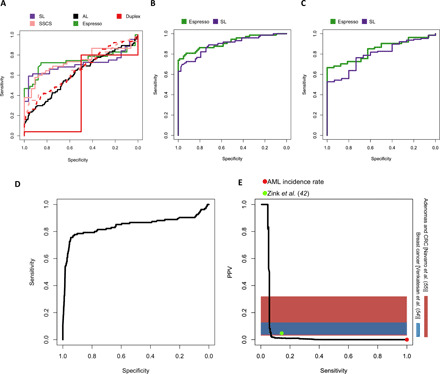
Classification performance evaluation of pre-AML and control, mutated samples. (A) Each classifier was trained and tested on the mutations that were obtained from the classifier’s corresponding method. (B) Comparison between the Espresso and the SL-derived classifiers. In this iteration, each classifier was trained using its corresponding method’s mutation calls and was tested in its accuracy to classify pre-AML cases and controls, including mutated samples identified by the other method as well. (C) Comparative performance validation between the Espresso and the SL-derived classifiers to differentiate between pre-AML and control samples obtained from an additional validation dataset (8). Information regarding the study participant’s age, specific mutations, and their VAFs was obtained directly from the main text. (D) Performance estimation using the validation dataset and simulated controls. (E) Precision-recall trade-offs are calculated at the individual level (that is, serial samples are accounted for single individuals and individuals without any mutations are also included in the performance measurements). The red dot indicates AML’s incidence rate. This is equivalent to a situation where no screen is being conducted at all [PPV = incidence rate = 0.006% (44), SN = 100%]. The green dot indicates the model performance using an additional published dataset consisting of 11,262 individuals when the model was set to achieve 100% specificity in the training set. Horizontal color bars represent PPV ranges determined for screening mammography for breast cancer (54) and fecal immunochemical test for advanced adenomas and colorectal cancer (CRC) (55). Comparison with the genetic risk model performance shows the extent to which sensitivity must be compromised to achieve PPV comparable with these widely applied early detection tests.