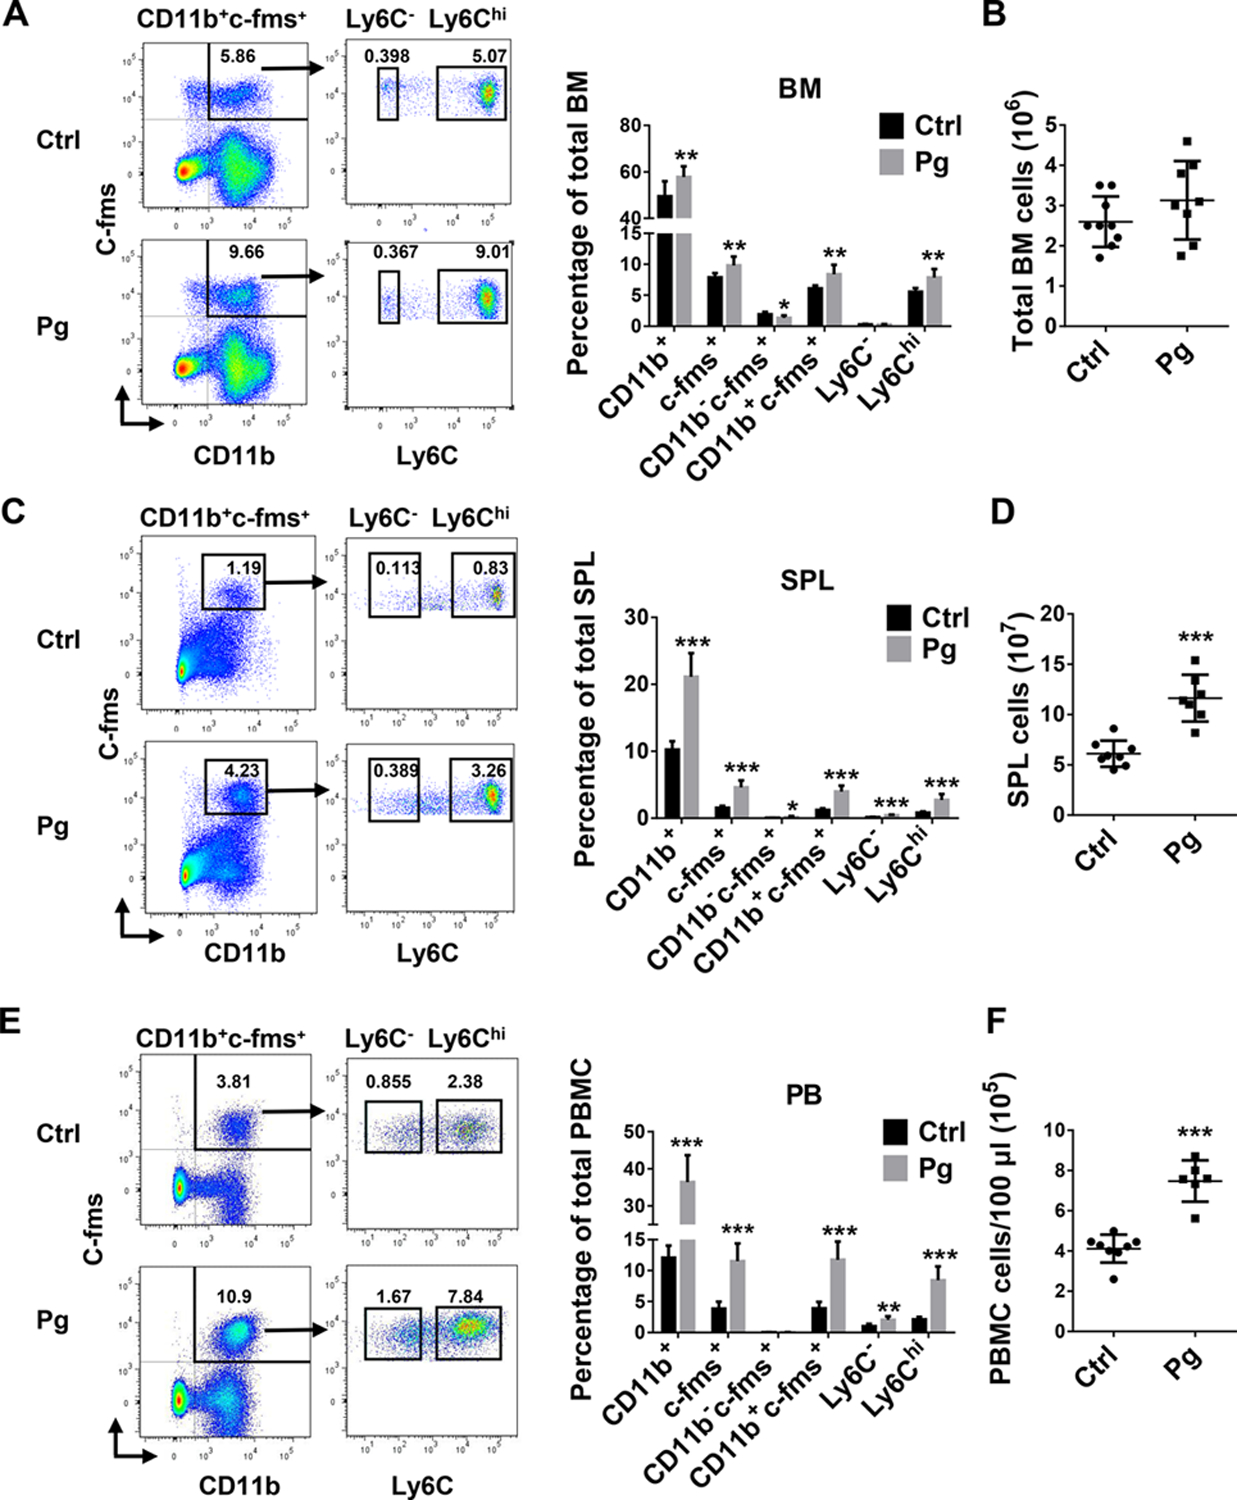
FIGURE 2. CD11b+c-fms+Ly6Chi population accumulate in BM, SPL and PB following Pg infection.

(A) Representative flow cytometry plots and percentage of myeloid cell population in BM of Ctrl and Pg-infected mice. (B) Total cell numbers in BM of Ctrl and Pg-infected mice (n=9 for Ctrl group and n=8 for Pg-infected group in A and B). (C) Representative flow cytometry plots and percentage of myeloid cell populations in SPL of Ctrl and Pg-infected mice. (D) Total cell numbers in SPL of Ctrl and Pg-infected mice (n=8 for Ctrl group and n=7 for Pg-infected group in C and D). (E) Representative flow cytometry plots and percentage of myeloid cell populations in PB of Ctrl and Pg-infected mice. (F) Total cell numbers in PB of Ctrl and Pg-infected mice (n=8 for Ctrl group and n=6 for Pg-infected group in E and F). Data are expressed as mean ± SD. *P < 0.05, **P < 0.01, ***P < 0.001.
