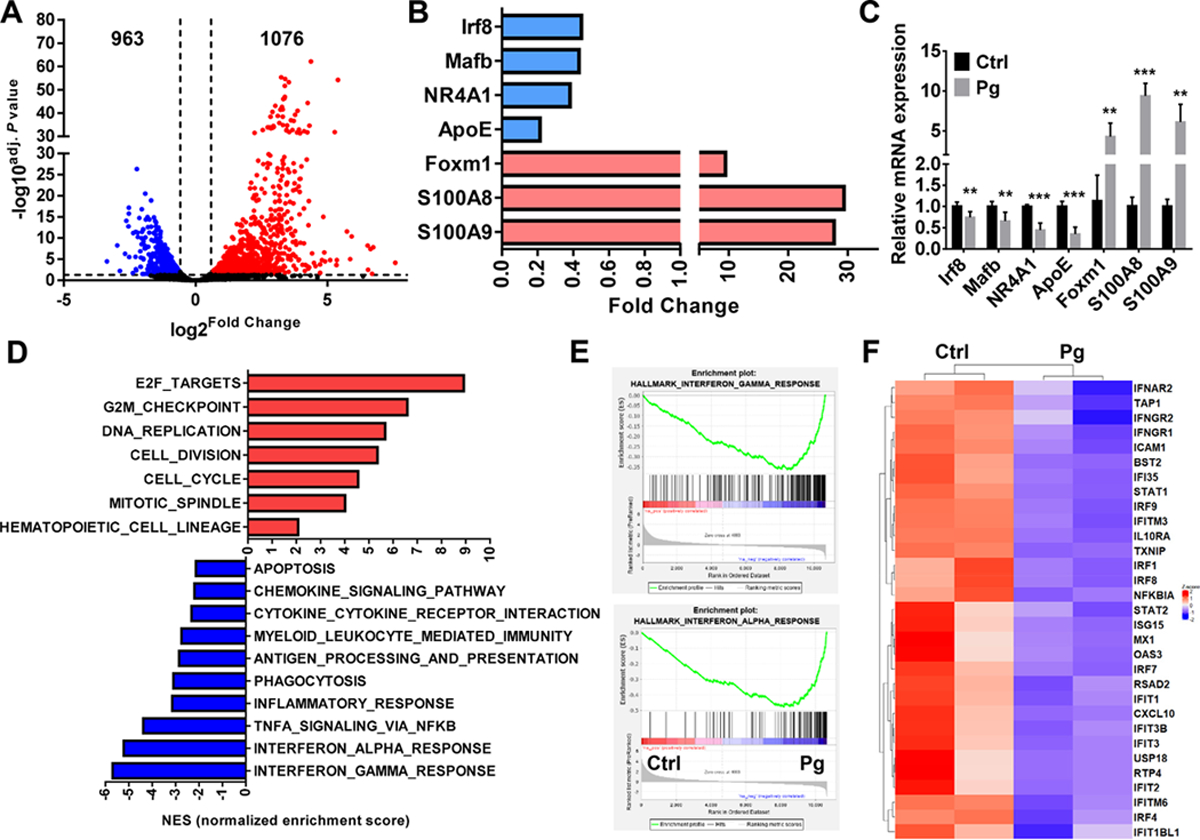
FIGURE 6. A unique gene expression profile in CD11b+c-fms+Ly6Chi population is induced by Pg infection.

Cell sorting was followed by mRNA extraction and RNA-Seq (n=2). (A) Volcano plot showing upregulated (red) and downregulated genes (blue) in CD11b+c-fms+Ly6Chi population of Pg-infected mice relative to control ones. (B) Changed genes related with OC differentiation in CD11b+c-fms+Ly6Chi population of Pg-infected mice relative to control ones. (C) mRNA levels of indicated genes in CD11b+c-fms+Ly6Chi population of Ctrl and Pg-infected mice (n=6). (D) GSEA of upregulated and downregulated pathways in CD11b+c-fms+Ly6Chi population of Pg-infected mice relative to control ones ranked by normalized enrichment score (NES). (E) The GSEA enrichment plot of the genes related with IFN-α and IFN-r and response. (F) Heatmap of differentially expressed genes (DEGs) related with IFN-α and IFN-r pathway. Data are expressed as mean ± SD. **P < 0.01, ***P < 0.001.
