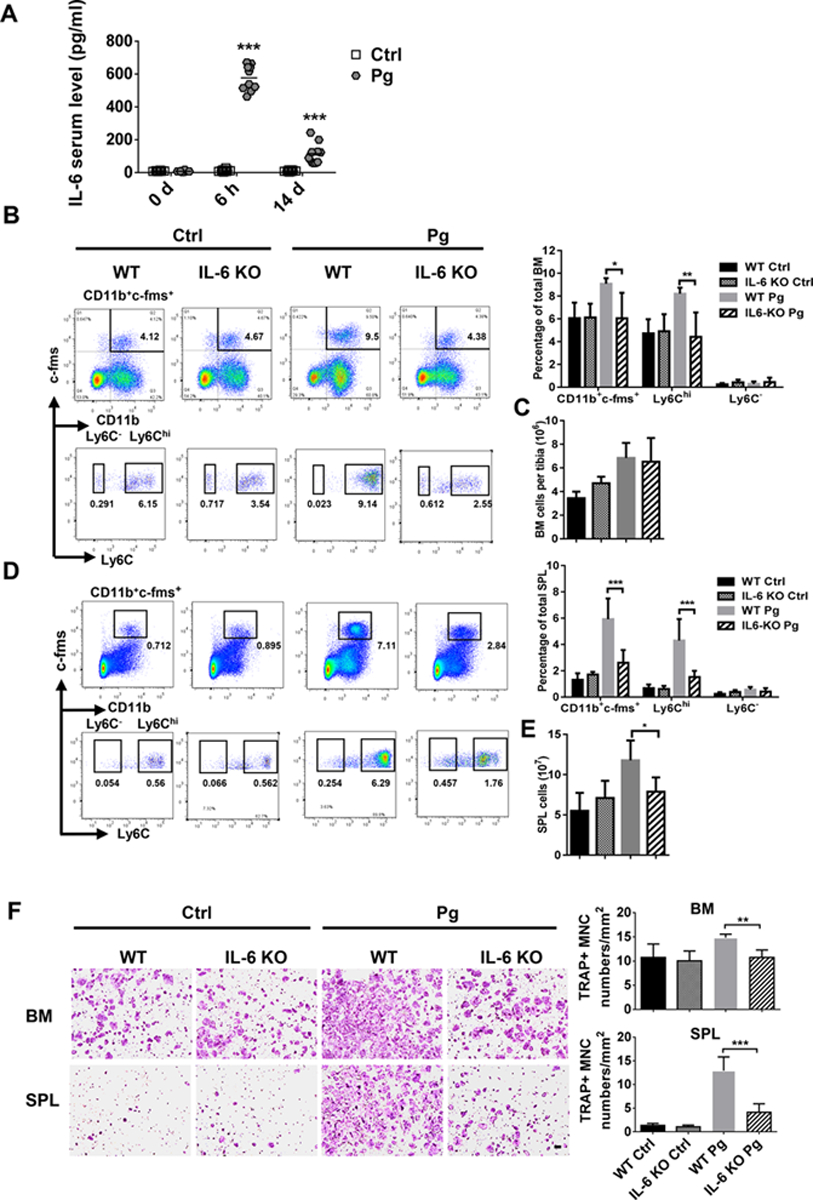
Figure 7. IL-6 deficiency impairs Pg-mediated accumulation of CD11b+c-fms+Ly6Chi population in BM and SPL.

(A) Serum IL-6 level at 0 h, 6 h and day 14 after Pg infection (n=10). (B) Percentage of myeloid cells subpopulations in BM of Ctrl and Pg-infected WT and IL-6 KO mice. (C) Total cell numbers in the BM of Ctrl and Pg-infected groups of WT and IL-6 KO mice (n=4 for WT and IL-6 KO control mice and n=6 for WT and IL-6 KO Pg-infected mice in B and C). (D) Percentage of myeloid cells subpopulations in SPL of Ctrl and Pg-infected groups of WT and IL-6 KO mice. (E) Total cell numbers in SPL of Ctrl and Pg-infected groups of WT and IL-6 KO mice (n=8 for WT control mice, n=6 for IL-6 KO control mice, n=7 for WT Pg-infected control mice and n=6 for IL-6 KO Pg-infected mice in D and E). (F) Multinucleated TRAP+ OC formation in the cultures of BM and SPL cells from WT and IL-6 KO mice with or without Pg infection (n=4 for WT and IL-6 KO control mice and n=6 for WT and IL-6 KO Pg-infected mice of BM; and n=5 for WT and IL-6 KO control mice and n=6 for WT and IL-6 KO Pg-infected mice of SPL). Data are expressed as mean ± SD. Scale bar, 200 μm. *P < 0.05, **P < 0.01, ***P < 0.001.
