. 2020 Nov 19;9:e61964. doi: 10.7554/eLife.61964

Figure 1. Interaction of the PRC2 catalytic lobe with nucleosomal DNA orients the H3 N-terminus for H3K27 binding to the active site.

(A) Domain organization in the five subunits of PHF1-PRC2. Dashed boxes indicate protein portions visible in the PHF1-PRC2:di-Nuc cryo-EM reconstruction and fitted in the structural model. In PHF1, C corresponds to the short C-terminal fragment used in PHF1C-PRC2. (B) Coomassie-stained SDS PAGE analysis of representative PHF1-PRC2 (upper panel) and Xenopus laevis (X.l.) octamer preparations (lower panel) after size-exclusion chromatography (SEC) purification. Pooled fractions of PHF1-PRC2, incubated with heterodimeric dinucleosomes generated by DNA ligation of a reconstituted unmodified and a H3Kc27me3-modified mononucleosome as described in Poepsel et al., 2018 were used as input material for cryo-EM analysis. (C) Cryo-EM reconstruction of PHF1-PRC2:di-Nuc in two orientations with fitted crystal structures of human PRC2 catalytic lobe (PDB: 5HYN, Justin et al., 2016) and nucleosomes (1AOI, Luger et al., 1997) in a di-Nuc model with 35 bp linker DNA (see also Figure 1—figure supplements 14, Supplementary file 1, Figure 1—video 1, Source code 1). Density is colored as in (A) to show PRC2 subunits, DNA (blue) and octamers of substrate (pink) and allosteric (yellow) nucleosomes. Boxes indicate regions shown in (D), (E) and (F), respectively. (D) Interaction of EZH2CXC residues with the DNA gyres of the substrate nucleosome; residues mutated in PRC2CXC>A are indicated. For the H3 N-terminus (pink), only the peptide backbone is shown in this view (see F). (E) Interface formed by EED and the EZH2 SBD domain with DNA gyres on the allosteric nucleosome; residues mutated in PRC2EED>A are indicated. Asterisk indicates the approximate location of a residue, which is not built in the model. (F) The H3 N-terminus (pink), shown as a pseudoatomic model fitted into the 4.4 Å density map, is recognized by EZH2 through an extensive interaction network (see text). Note the well-defined side-chain density of H3K36 (see also Figure 1—figure supplement 3D and Figure 1—figure supplement 4C–E).

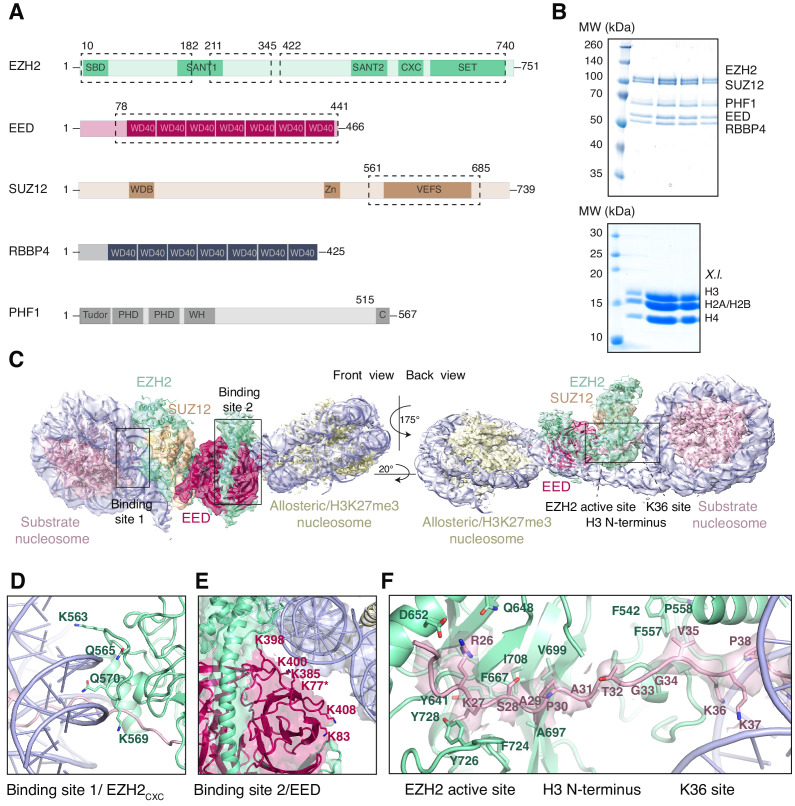
Figure 1.

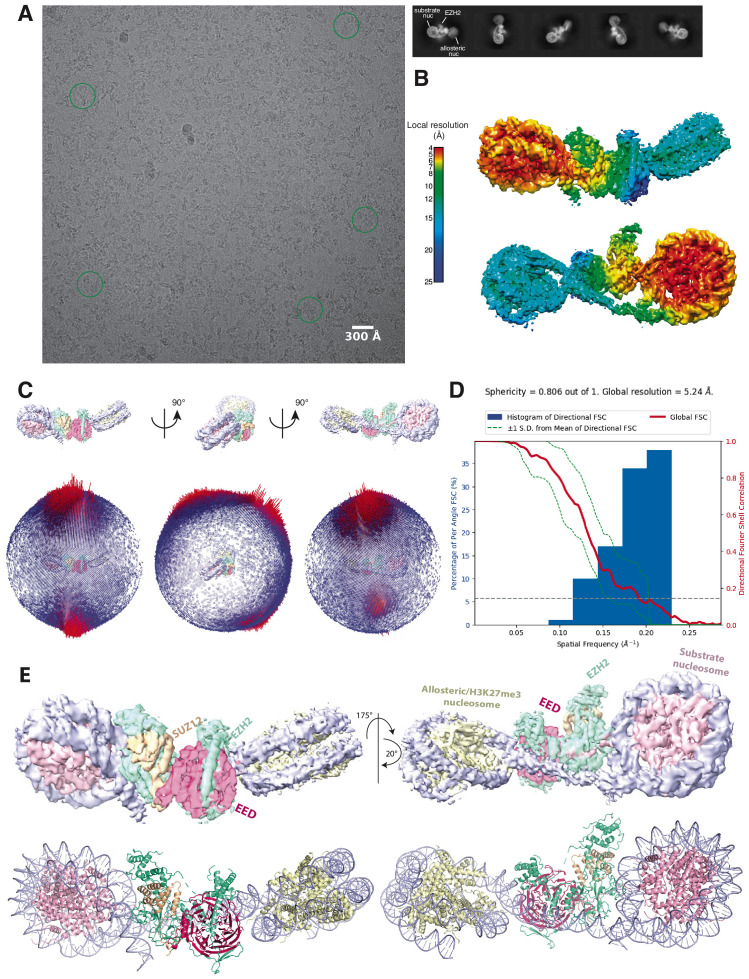
Figure 1—figure supplement 1. Initial Cryo-EM analysis of the PHF1-PRC2:di-Nuc complex (related to Figure 1).

Figure 1—figure supplement 1.

(A) Representative micrograph of the cryo-EM dataset (left) and reference-free 2D classes from particles picked without templates (right) (performed to ensure that no bias was introduced through templates picking and references in 3D classification). Circles indicate particles, which were picked with templates and directly subjected to 3D analysis (see Figure 1—figure supplement 2). (B) Local resolution estimation of the 5.2 Å overall PHF1-PRC2:di-Nuc map. The substrate nucleosome and the adjacent part of EZH2 are well resolved (colors red to yellow). (C) Spherical angular distribution of particles included in the final reconstruction of PHF1-PRC2:di-Nuc. (D) Output from the 3DFSC Processing Server (https://3dfsc.salk.edu/ Tan et al., 2017) showing the Fourier Shell Correlation (FSC) as a function of spatial frequency, generated from masked independent half maps of PRC2:diNuc: global FSC (red), directional FSC (blue histogram) and deviation from mean (spread, green dotted line). The nominal overall resolution of 5.24 Å was estimated according to the gold standard FSC cutoff of 0.143 (gray dotted line) (Rosenthal and Henderson, 2003). Sphericity is an indication for anisotropy and amounts to 0.806 in this data. The minor directional anisotropy of the data can be explained by the slightly preferred orientation and missing views as seen in (C). (E) Top: Refined and postprocessed cryo-EM density map of overall PHF1-PRC2:di-Nuc colored according to the subunit organization. Bottom: pseudoatomic model of fitted crystal structure of the human PRC2 catalytic lobe (PDB: 5HYN; Justin et al., 2016) and a di-Nuc model with 35 bp linker DNA (Poepsel et al., 2018), including PDB 1AOI (Luger et al., 1997).
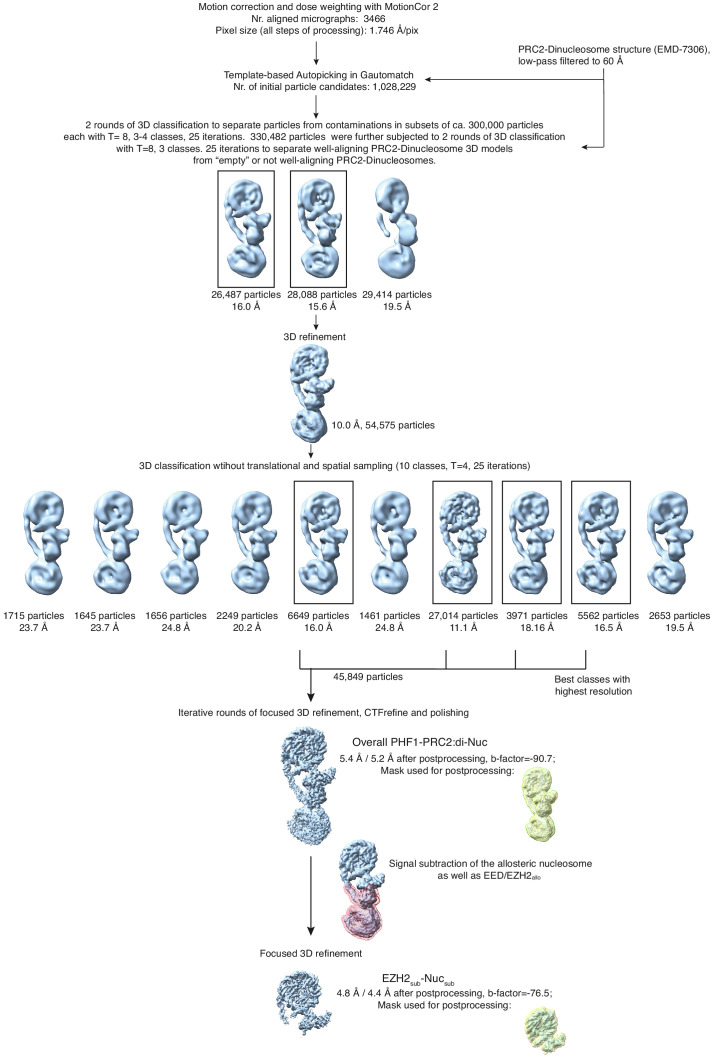
Figure 1—figure supplement 2. Overview of the cryo-EM Data-Processing and Particle Sorting Scheme (related to Figure 1).

Figure 1—figure supplement 2.

Processing and particle sorting scheme, also described in Methods. Squares indicate 3D classes (and corresponding particles) chosen for further processing steps based on their nominal global resolution values, translational and rotational accuracy and the presence of detailed structural information. Two final reconstructions were obtained in this study: Overall PHF1-PRC2:di-Nuc, and EZH2sub-Nucsub after performing signal subtraction (mask indicated in pink) and focused refinement. Masks used for postprocessing are shown in yellow.
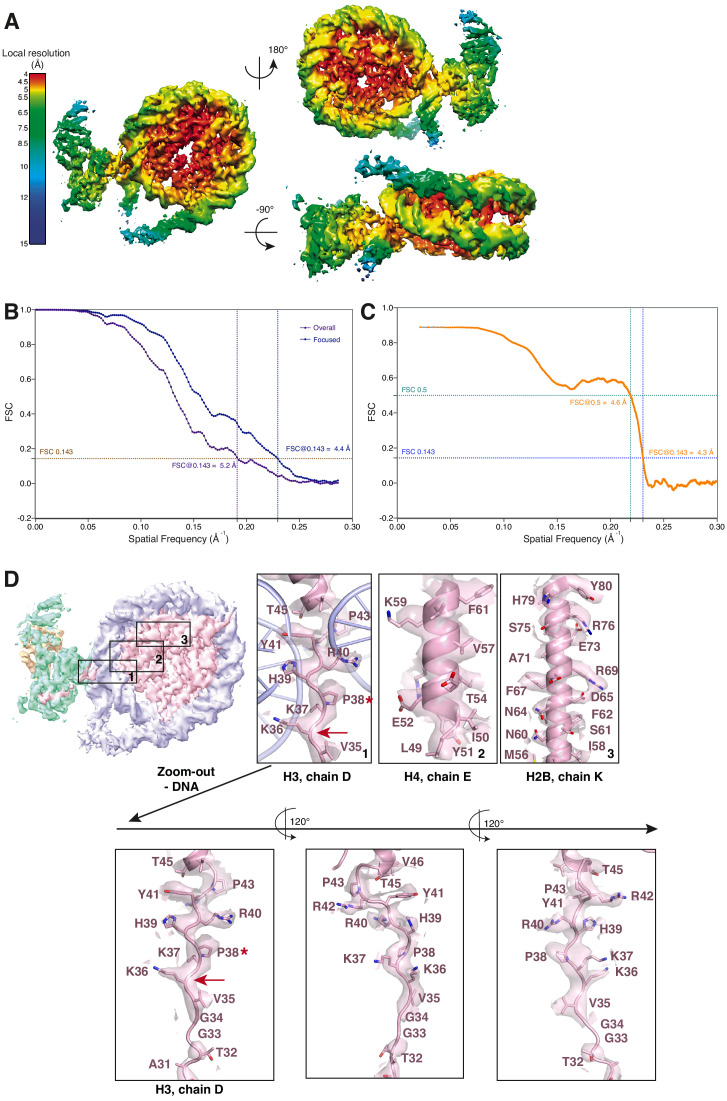
Figure 1—figure supplement 3. Cryo-EM analysis of the focused EZH2sub-Nucsub map (related to Figure 1).

Figure 1—figure supplement 3.

(A) Local resolution estimation of the focused 4.4 Å EZH2sub:Nucsub reconstruction. Regions in the nucleosome core as well as the adjacent regions including parts of the H3 N-terminus close to the exit side of the nucleosome are well resolved (4.0–5.5 Å). Regions close to the mask, especially the nucleosomal DNA and parts of EZH2, are less well resolved (colors green to blue). (B) Global FSC generated from masked independent half maps of EZH2sub-Nucsub (Focused, blue line) and the overall PHF1-PRC2:di-Nuc (Overall, violet line) were plotted against spatial frequency. The resolution of 4.4 Å for EZH2sub-Nucsub map and 5.2 Å for the overall PHF1-PRC2:di-Nuc map were estimated according to the gold standard FSC cutoff of 0.143 (brown dotted line) (Rosenthal and Henderson, 2003) (C) FSC between the atomic model and the masked (applied in Phenix) map of EZH2sub-Nucsub after real-space refinement (Afonine et al., 2018). Green line represents the cut-off at 0.5 (4.6 Å) and blue line represents the cut-off at 0.143 (4.3 Å) (see also Supplementary file 1; Rosenthal and Henderson, 2003; Henderson et al., 2012; Rosenthal and Rubinstein, 2015). (D) Selected regions within EZH2sub-Nucsub showing side-chain density, e.g. K36 (red arrow). A red asterisk indicates the last residue of the H3 tail visible in known crystal structures (usually P38 or H39). The quality of the map around K36 is shown as a separate zoom-out below and in three different views to demonstrate the lack of anisotropy present in the density.
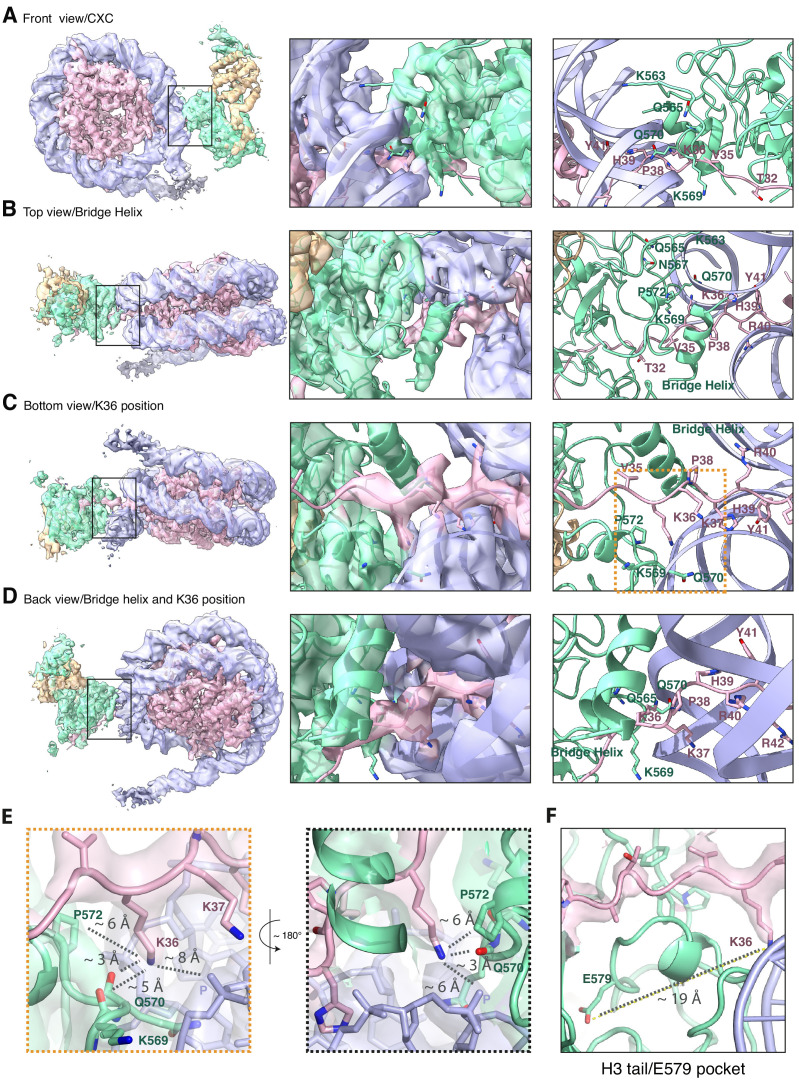
Figure 1—figure supplement 4. The improved map of the interaction between EZH2 and the substrate nucleosome after focused refinement reveals location of H3K36 and its environment (related to Figure 1).

Figure 1—figure supplement 4.

(A) The front view of EZH2sub-Nucsub cryo-EM density and model shows details of the EZH2CXC interaction with nucleosomal DNA. (B) The top view of EZH2sub-Nucsub cryo-EM shows a tubular density into which based on recent findings of the Nogales labKasinath et al., 2020 ) an α-helix was built. The "bridge helix" (Kasinath et al., 2020) which based on this study is likely constituted of the EZH2 residues 497–511, is located above V35 of the H3 tail. As can be seen when observing the density-modified map (Terwilliger et al., 2020) of EZH2sub-Nucsub at lower threshold, it presumably engages in interactions with the nucleosomal DNA, the H3 tail and EZH2, as described in greater detail in Kasinath et al., 2020. (C) The bottom view of EZH2sub-Nucsub cryo-EM density and model shows details of the vicinity of K36 with the corresponding density for the H3 tail, EZH2 and nucleosomal DNA. The orange square indicates the region shown as a zoom-in in (E). (D) The back view of EZH2sub-Nucsub cryo-EM density and model shows details of the location of K36 and the "bridge helix" (Kasinath et al., 2020 ). (E) Zoom-in views of H3K36 and its chemical environment. Approximate distances of the epsilon-amino group of H3K36 to the nearest residues are indicated with a dotted gray line. (F) Location of the Glu-579 pocket (Jani et al., 2019) in the EZH2sub:Nucsub reconstruction and its distance to H3K36 (app. 19 Å). The described mechanism by Jani et al., 2019 involving recognition of H3K36 by Glu-579 is incompatible with the presented structural data as the location differs significantly and major rearrangements as the relocation of the helix-loop region between residues 564–576 would be necessary to avoid the given steric and geometric hindrance and allow for potential interaction.
Figure 1—video 1. Cryo-EM structure of the PHF1-PRC2:di-Nuc complex (related to Figure 1).
Download video file (32.3MB, mp4)
Movie of the cryo-EM structure of PHF1:PRC2 on a heterodimeric dinucleosome. The rotation of the structure elucidates the recognition of the nucleosomes by the catalytic lobe of PRC2 (Justin et al., 2016). A zoom-in on the H3 tail shows how the tail is thread into the active site of EZH2.