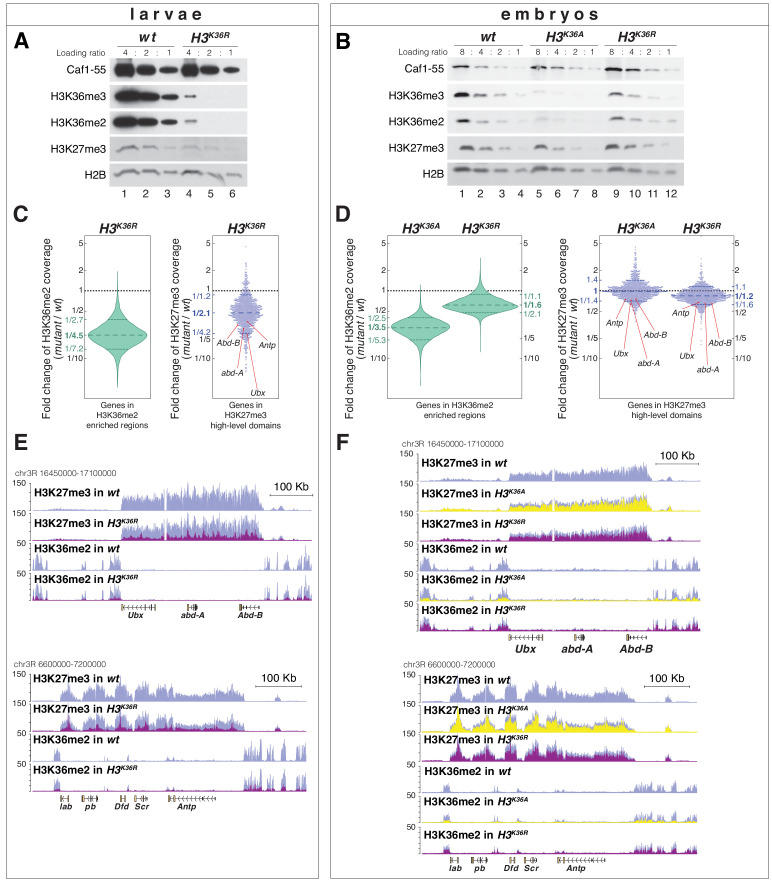
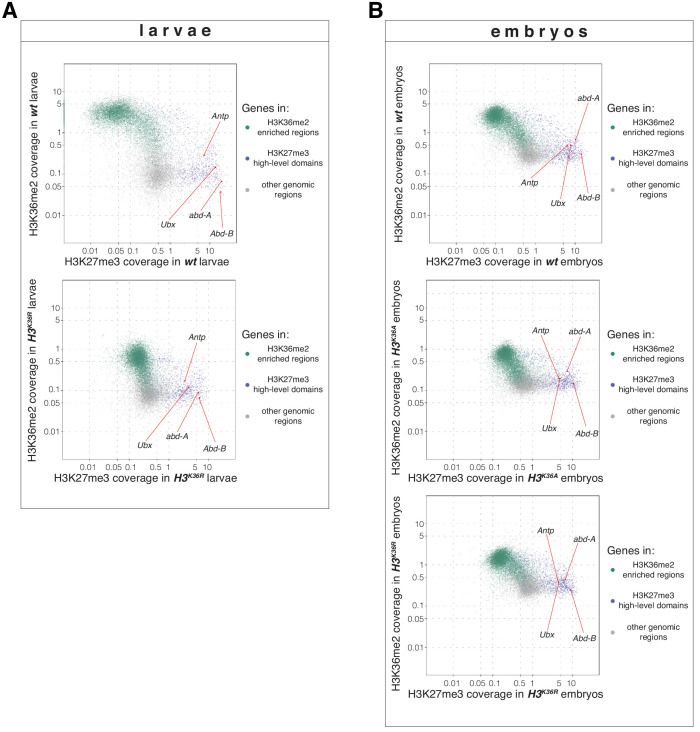
Figure 5. H3K36A and H3K36R mutants show reduced levels of H3K27me3.
(A) Western blot analysis on serial dilutions (4:2:1) of total cell extracts from wing, haltere and 3rd leg imaginal disc tissues dissected from wildtype (wt, lanes 1–3) and H3K36R mutant (lanes 4–6) third instar larvae. Blots were probed with antibodies against H3K36me3, H3K36me2, or H3K27me3; in each case, probing of the same membranes with antibodies against Caf1-55 and H2B served as controls for loading and western blot processing. Note the reduced levels of H3K36me3 and H3K36me2 but also of H3K27me3 in H3K36R mutants compared to wildtype (wt) (see text). See Materials and Methods for details of all genotypes. (B) Western blot analysis on serial dilutions (8:4:2:1) of total nuclear extracts from 21 to 24 hr old wt (lanes 1–4), H3K36A mutant (lanes 5–8) and H3K36R mutant (lanes 9–12) embryos, probed with antibodies against H3K36me3, H3K36me2 or H3K27me3; and with antibodies against Caf1-55 and H2B as controls. Note that H3K36me3 and H3K36me2 levels are reduced in H3K36A mutants but not in H3K36R mutants where they are comparable to wt. Also note that H3K27me3 levels appear undiminished in either mutant (see text). (C) Left, violin plot showing the fold-change of H3K36me2 coverage in H3K36R mutant larvae relative to wt at genes that in wildtype larval CNS and imaginal disc tissues are decorated with H3K36me2 (see Materials and Methods). The dashed line marks the median reduction (4.5-fold), the dotted lines indicate the interval comprising 80% of regions. Right, Bee plot showing the fold-change of H3K27me3 coverage in H3K36R mutant larvae relative to wt at genes that in wildtype larval CNS and imaginal disc tissues are associated with high-level H3K27me3 regions (see Materials and Methods). The dashed line marks the median reduction (2.1-fold), the dotted lines indicate the interval comprising 80% of regions. Note that H3K27me3 coverage at the HOX genes abd-A, Abd-B, Ubx and Antp is between 3- and 4-fold reduced. (D) Analysis and representation as in (C) but showing fold-changes in H3K36me2 and H3K27me3 coverage in H3K36A and H3K36R mutant late-stage embryos relative to wt at genes that in wildtype embryos are decorated with H3K36me2 and H3K27me3, respectively. Note that H3K27me3 coverage at the HOX genes abd-A, Abd-B, Ubx and Antp is about 1.5-fold reduced. See also Figure 5—figure supplement 1. (E) H3K27me3 and H3K36me2 ChIP-seq profiles in larval CNS and imaginal disc tissues from wt (blue) and H3K36R mutant (purple) third instar larvae; in the tracks showing the profiles in the H3K36R mutant, the wt profile is superimposed as reference (see Supplementary file 2 and Materials and Methods for information about normalization). Top: genomic interval containing the Bithorax-Complex harboring the HOX genes Ubx, abd-A and Abd-B; bottom: genomic interval containing the Antennapedia-Complex with the HOX genes lab, pb, Dfd, Scr, and Antp. Note the 3- to 4-fold reduction of H3K27me3 levels across the Bithorax and Antennapedia loci in H3K36R mutants. Also note that for every HOX gene, the analyzed tissues (CNS, thoracic imaginal discs and eye-antenna discs) represent a mixed population of cells with a fraction of cells in which the gene is inactive, decorated with H3K27me3 and repressed by PcG and fraction of cells in which the gene is transcriptionally active and carrying the H3K36me2 modification. (F) H3K27me3 and H3K36me2 ChIP-seq profiles at the Bithorax and Antennapedia loci as in (E) but from wt (blue), H3K36A mutant (yellow) and H3K36R mutant (purple) late-stage embryos with the wt profile superimposed in the tracks showing the profiles in the H3K36A and H3K36R mutants. H3K27me3 levels across the Bithorax and Antennapedia loci in H3K36A and H3K36R mutants are only about 1.5-fold reduced compared to wt.


