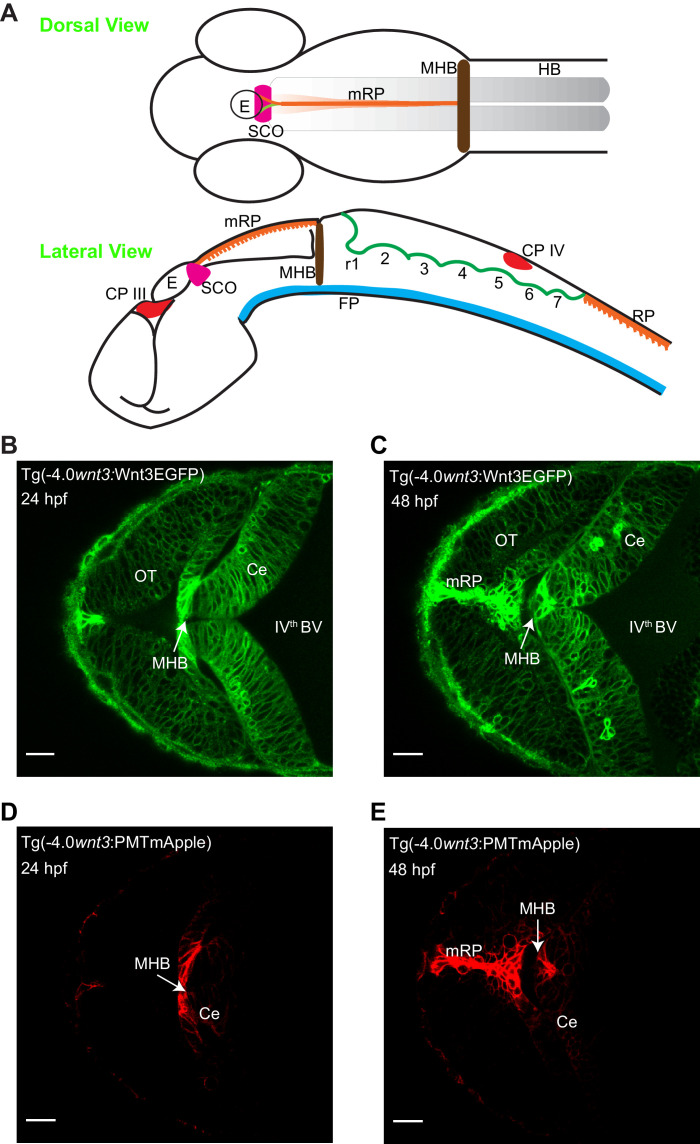
Figure 1. Spatiotemporal expression of wnt3 promoter-driven Wnt3EGFP and PMTmApple.
(A) Schematic illustration of the brain of a zebrafish embryo (dorsal view and lateral view). Expression profile of Wnt3EGFP in Tg(−4.0wnt3:Wnt3EGFP) line at (B) 24 hpf and (C) 48hpf. Expression profile of PMTmApple in Tg(−4.0wnt3:PMTmApple) line at (D) 24 hpf and (E) 48hpf. BV, brain ventricle; Ce, cerebellum; CP, choroid plexus; E, epiphysis; FP, floor plate; HB, hindbrain; MHB, midbrain–hindbrain boundary; mRP, midbrain roof plate; OT, optic tectum; r, rhombomere; RP, roof plate (spinal cord); SCO, sub-commissural organ. SCO and E are regions of the epithalamus (Epi). Images orientation: anterior to the left. Scale bar 30 μm.

