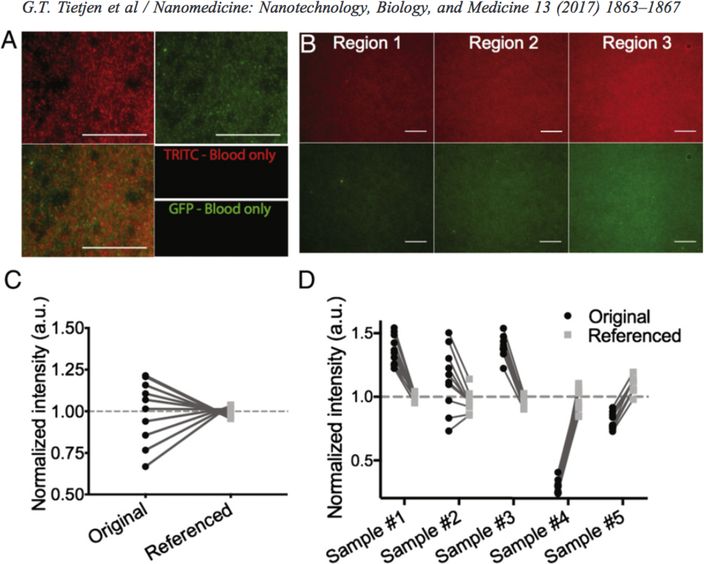
Figure 1. Reference NP corrects for heterogeneity within and between samples.
(A) Representative images of Dil (red) and DiO (green) NPs demonstrating co-localization (overlay). (B) Independent regions within one sample showing varying intensity of Dil (top) and corresponding DiO-NP (bottom) images. Quantification of mean intensity for: (C) single sample of Dil-NP at 50 pg/mL or (D) 5 simultaneously collected samples from a single mouse before (black circles) and after referencing (gray squares); lines connect identical images. Values are normalized to the mean of their respective group (referenced or unreferenced). Scale bars represent 100 μm.

