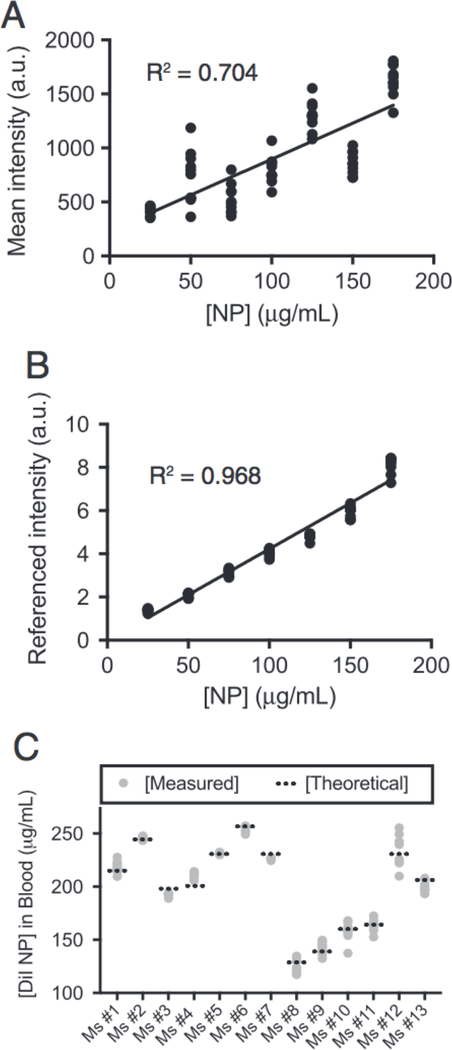
Figure 2. Quantitative microscopy recapitulates expected concentration in vivo.
Unreferenced (A) and referenced (B) standard of Dil-NPs. Each data point represents an individual image; line represents linear fit. (C) Quantification of circulating NP concentration 2 min after injection; each gray dot represents an individual image (10× per mouse). Theoretical values (dashed line) were calculated by amount of NP administered divided by mouse blood volume (from animal mass).

