
Figure 2.
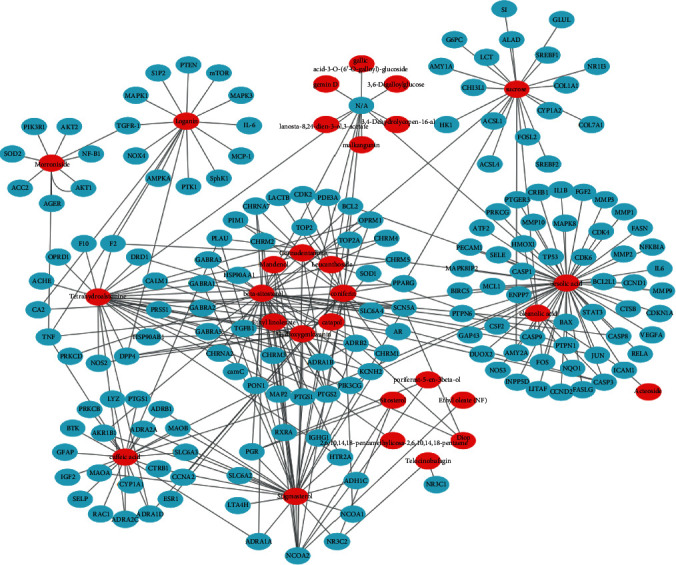
Active compound-potential target network. The C-T network was constructed by active compounds and their potential targets. The red ellipses represent the 29 active compounds, and the blue ellipses represent the 170 potential targets on which the compounds act.