Figure 3.

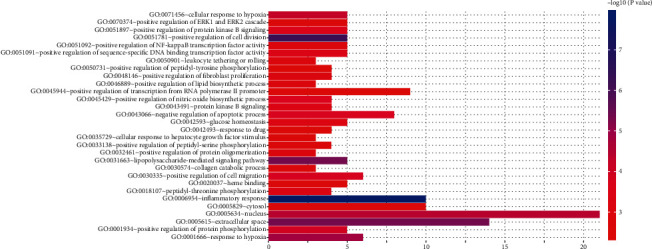
GO enrichment analysis of key targets. The number of GO entries in the functional categories of cell composition, molecular function, and biological process (FDR < 0.05).

GO enrichment analysis of key targets. The number of GO entries in the functional categories of cell composition, molecular function, and biological process (FDR < 0.05).