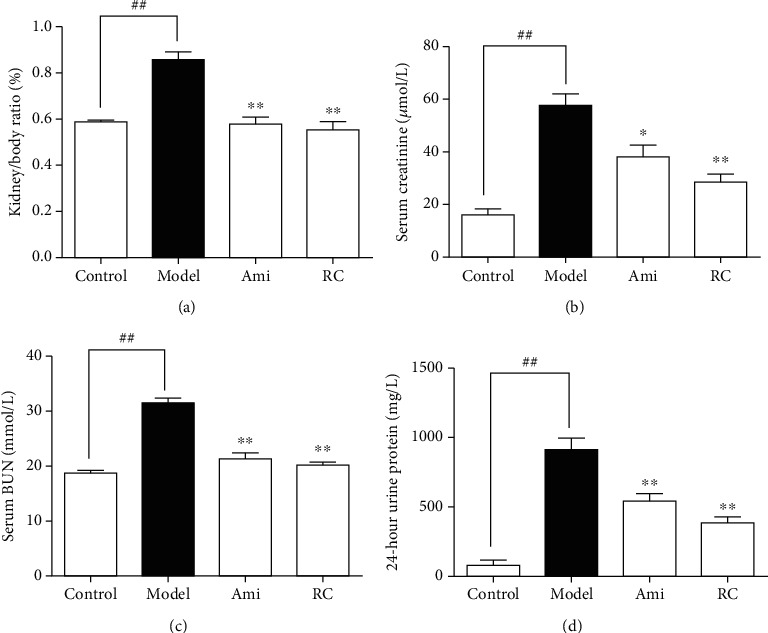
Figure 6.

RC improved kidney function in DN mice. (a) Kidney/body weight ratios at the end of the experiments. (b) Creatinine levels in serum. (c) BUN levels in serum. (d) 24 h urine protein in the 8th week at the end of the experiment. Significance: ##P < 0.01 versus the control group, ∗P < 0.05, ∗∗P < 0.01 versus the DN group.
