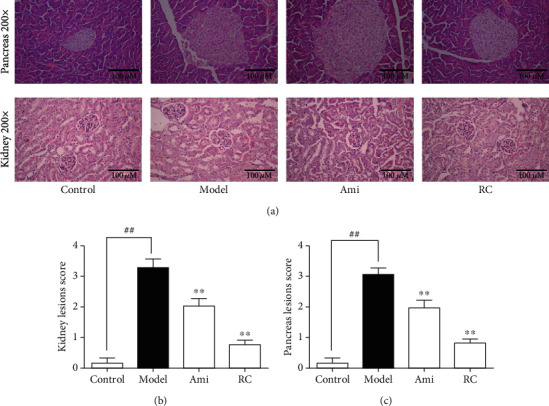
Figure 8.

RC improved the pathohistology of the kidneys and pancreas in DN mice. (a) Images of the HE sections in the pancreas (magnification = 200x) and testes (magnifications = 200) of each group. (b) Statistical chart of the kidney lesion score. (c) Statistical chart of the pancreas lesion score. Significance: ##P < 0.01 versus the control group, ∗P < 0.05, ∗∗P < 0.01 versus the DN group.
