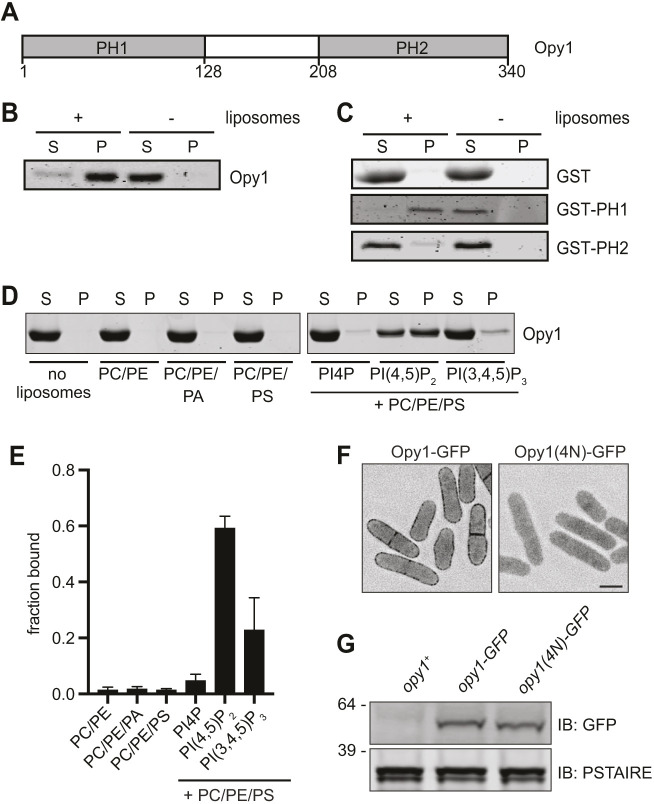
Fig. 1.
Opy1 binds PI(4,5)P2-containing membranes. (A) Schematic of Opy1. Amino acid numbers are indicated below the schematic. PH1 and PH2 indicate pleckstrin homology domains. (B) Co-pelleting assay with Folch fraction liposomes and full-length Opy1. (C) Co-pelleting assay with GST and GST fusions of PH1 (amino acids 1–128) and PH2 (amino acids 208–340). (D) Co-pelleting assay of full length Opy1 with liposomes of indicated compositions. See Materials and Methods for details. (E) Quantification of the mean fraction of Opy1 bound to liposomes of the indicated compositions from two experiments as shown in D. Data are presented as mean± s.e.m. (F) Live-cell imaging of Opy1–GFP and Opy1(4N)–GFP. GFP signal is shown in inverted grayscale. Scale bar: 5 µm. (G) Western blot showing expression of the indicated proteins in cell lysates. PSTAIRE was used as a loading control. Numbers on the left indicate position of molecular mass markers (kDa). IB, immunoblot. Experiments in B–G were repeated twice with similar results. S, supernatant; P, pellet.

