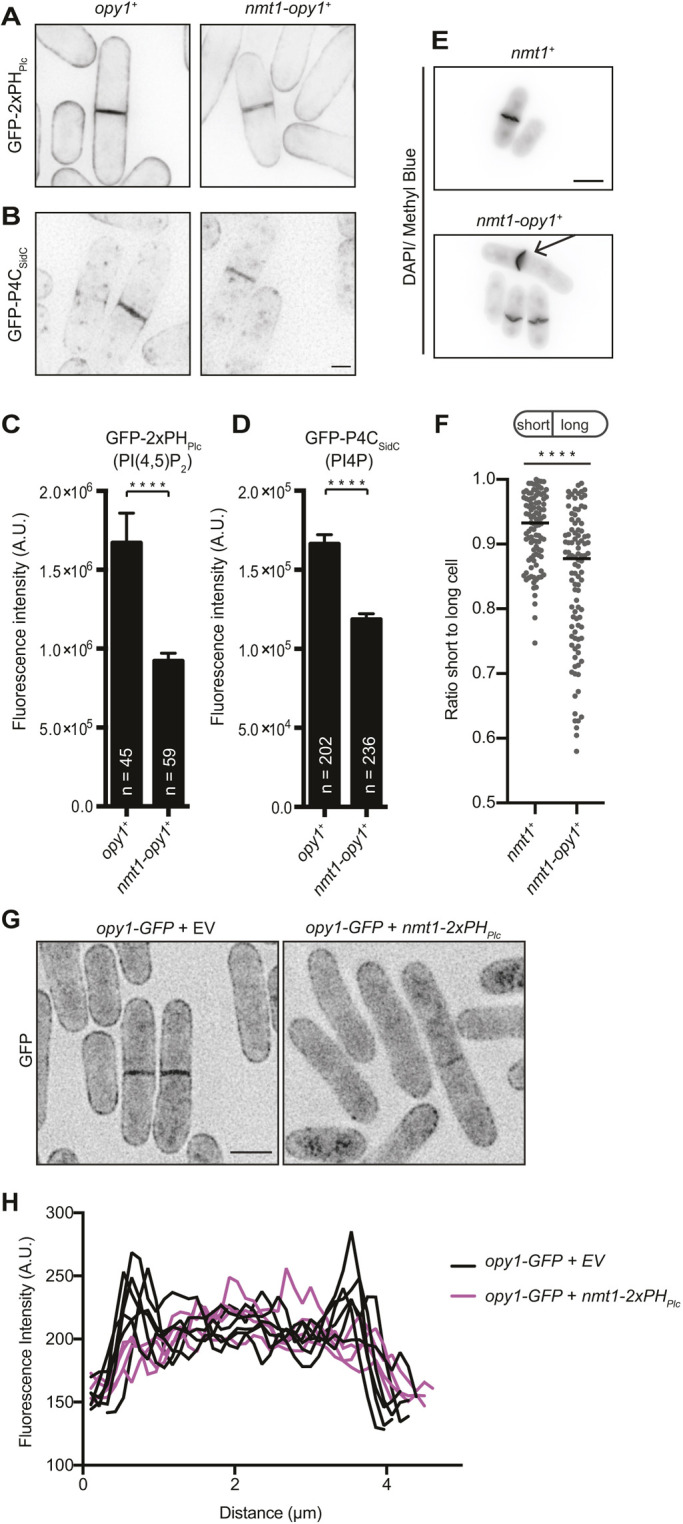
Fig. 4.

Opy1 overproduction results in cytokinesis defects. (A,B) Representative live-cell images of (A) GFP–2×PHPlc and (B) GFP–P4CSidC PIP biosensors in wild-type cells (opy1+) or cells overproducing opy1 from the nmt1 promoter (nmt1-opy1+). GFP signal is shown in inverted grayscale. Scale bar: 2 µm. (C,D) Quantification of division site intensity of (C) GFP–2×PHPlc and (D) GFP–P4CSidC biosensors, as shown in A and B. Data are presented as the mean±s.e.m. of three experiments. Total numbers of cells analyzed are shown on the graphs. ****P<0.0001 (unpaired, two-tailed Student's t-test). (E) Representative images of fixed cells stained with DAPI and Methyl Blue. Prior to fixation, overexpression was induced in cells carrying either empty vector (nmt1+) or an opy1 overexpression vector (nmt1-opy1+) for 28 h in medium lacking thiamine. Arrow indicates a cell with an off-center septum. DAPI/Methyl Blue signal is shown in inverted grayscale. Scale bar: 5 µm. (F) Quantification of off-center septation as a measure of the ratio of short to long daughter cell length for the strains described in E. Bars represent means. ****P<0.0001(unpaired, two-tailed Student's t-test). (G) Representative live-cell images of opy1–GFP cells expressing either an empty vector (EV) or nmt1-2×PHPlc. GFP signal is shown in inverted grayscale. Scale bar: 5 µm. (H) Five representative line scans across cells as described in G. Line scans were drawn from cortex to cortex in the area between the septum and curved ends of the cell.
