Fig. 1.
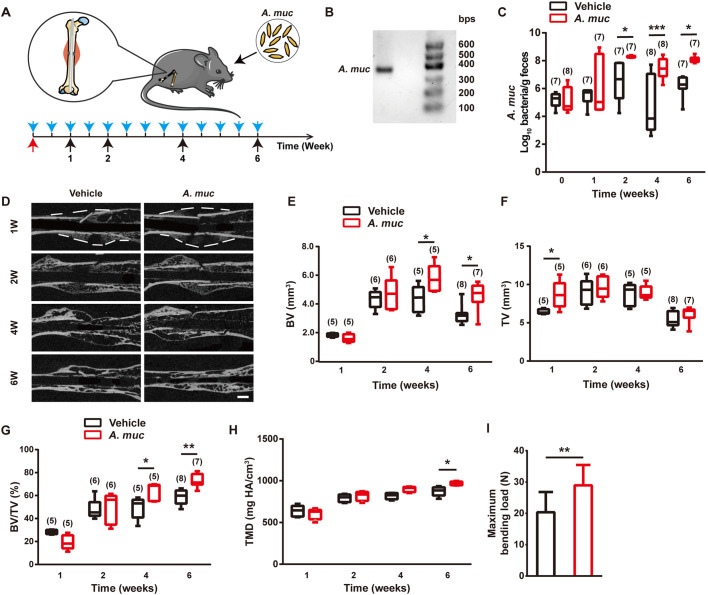
A. muciniphila treatment accelerates fracture healing. (A) Experiment design for testing the impact of A. muciniphila on fracture healing. The blue arrows indicate A. muciniphila administrations. The red arrow indicates the fracture surgery time point. The black arrows indicate time points to sacrifice mice. (B) Amplifed A. muciniphila (A. muc) DNA band detected by agarose gel electrophoresis. (C) Abundance of A. muciniphila in fecal samples was examined by qRT-PCR. The n of each group is shown in parentheses. (D) Representative µCT images of fractured femora from vehicle- or A. muciniphila-treated mice at different time points. Scale bar: 1 mm. (E-G) µCT quantitative analyses of BV (E), TV (F) and BV/TV (G) of fractured femora at 1, 2, 4 and 6 WPF. The n of each group is shown in parentheses. (H) Tissue mineral density (TMD) of callus at 1, 2, 4 and 6 WPF. n=5 per group. (I) Four-point bending measurement of femoral ultimate load at 6 WPF. n=10 per group. Data are mean±s.d. Whiskers represent minimum and maximum values, and boxes represent the interquartile range. *P<0.05, **P<0.01, ***P<0.001, two-way ANOVA with Bonferroni post-hoc test (C,E-H), or unpaired two-tailed Student's t-test (I).

