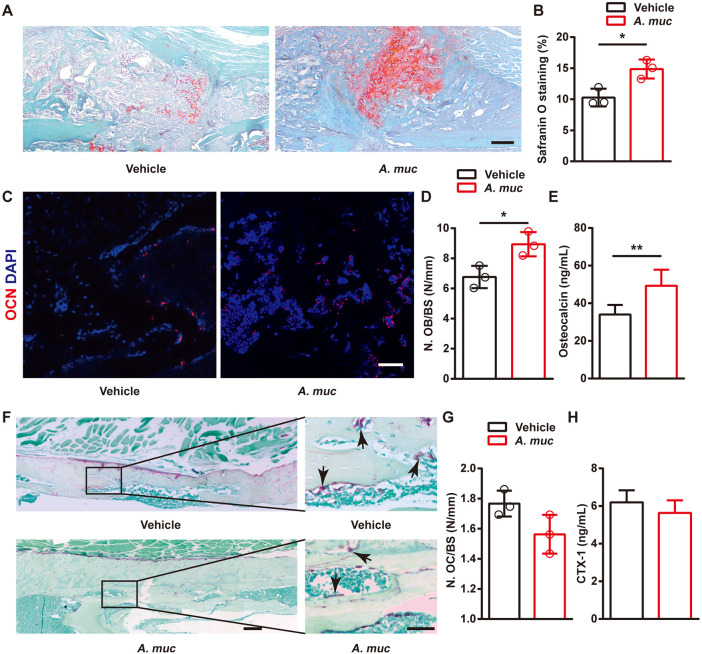
Fig. 2.
The effects of A. muciniphila treatment on chondroid callus formation, osteogenesis and osteoclastogenesis in fractured femora of mice. (A,B) Representative images of Safranin O staining (A) and quantification of the positive-stained area (B) in fractured femora from vehicle- or A. muciniphila-treated mice at 2 WPF. n=3 per group. (C,D) Representative OCN-stained sections (C) with quantification of osteoblast number (N. OB) (D) in fractured femora from vehicle- or A. muciniphila-treated mice at 6 WPF. n=3 per group. (E) Serum concentrations of OCN detected by ELISA at 6 WPF. n=6 per group. (F,G) Representative TRAP-stained sections (F) with quantification of osteoclast number (N. OC) (G) in fractured femora from vehicle- or A. muciniphila- treated mice at 6 WPF. Arrows indicate osteoclasts. n=3 per group. (H) Serum concentrations of CTX-1 detected by ELISA at 6 WPF. n=6 per group. Data are mean±s.d. *P<0.05, **P<0.01, unpaired two-tailed Student's t-test. Scale bars: 100 μm (A); 50 μm (C); 200 μm (left); 50 μm (right) (F).

