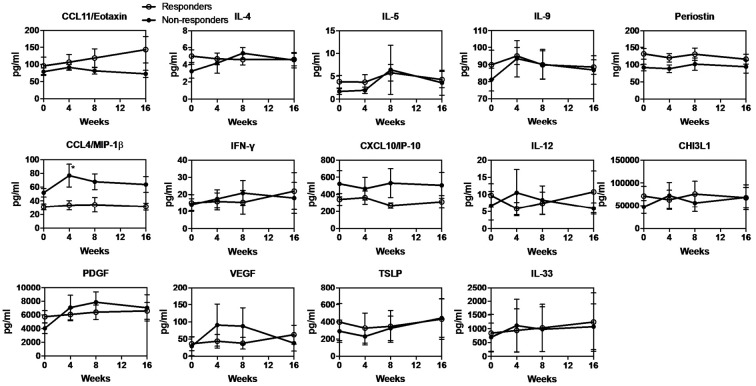
Figure 3.
Change in the serum cytokine levels in both responders and non-responders who underwent mepolizumab therapy. The serum cytokine levels at baseline and after 1, 4, 8 and 16 weeks in responders (white circles) and non-responders (black circles) are shown. Bars represent the mean±SEM. *p<0.05 vs. the baseline level.

