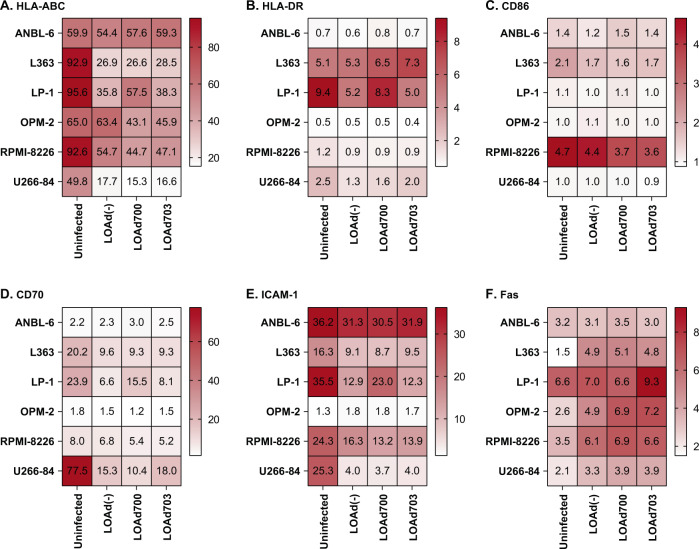
Fig. 5. Expression levels of immune markers on LOAd-infected multiple myeloma cells.
Cells were infected with 100 MOI of LOAd(−), LOAd700, and LOAd703 or left uninfected, cultured for 48 h and analyzed by flow cytometry for the expression of HLA-ABC (a), HLA-DR (b), CD86 (c), CD70 (d), ICAM-1 (e), and Fas (f). Heat maps display the mean of the geometric mean fluorescent intensity (MFI) of each marker divided by the MFI of matched isotype control antibodies (relative expression). n = 2.

