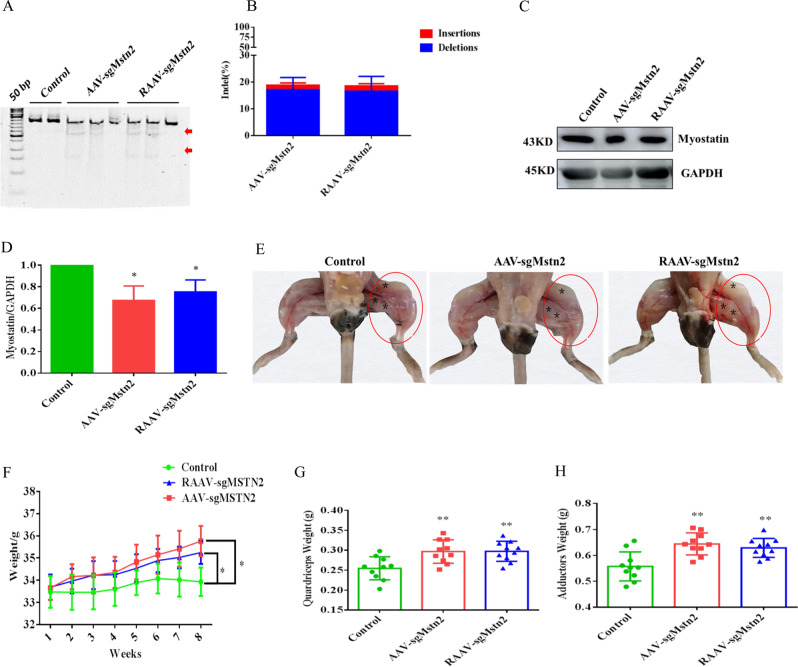
Fig. 2. AAV-delivery of SaCas9 for genome editing in the left thigh of aged C57BL/10 male mice.
a T7EI assay of mice genes produced by intramuscular injections of rAAV–SaCas9. Numbers of mutant muscle tissues with bands of 168, 338 and 506 bp in AAV-sgMstn2, RAAV-sgMstn2 and only one band of 506 bp in AAV-CN. The red arrow indicates the band of enzyme digestion. b Stacked histogram showing the percentage distribution of indels at Mstn in muscle tissues of mice, as measured by sequencing analyses. Data are presented as mean ± SEM from five mice in each group. c The muscle tissues in AAV-sgMstn2, RAAV-sgMstn2 and AAV-CN groups analyzed by western blot using an anti-MSTN antibody. And anti-GAPDH was used as loading control. d Stacked histogram showing the percentage distribution of MSTN expression in different muscle tissues. Data represent means ± SEM (The number of samples was 3 per group, and each sample was repeated three times). *: 0.01 < P < 0.05, **P < 0.01 when AAV-sgMstn2, RAAV-sgMstn2-treated were compared with AAV-CN-treated. e Changes of left thigh muscle mass in the aged mice in AAV-CN, AAV-sgMstn2 and RAAV-sgMstn2 groups. Compared with the AAV-CN-treated group, the muscle mass of the MSTN gene knockout group was significantly increased by AAV-sgMstn2 and RAAV-sgMstn2-treated groups (in red cycle). f Changes in body weight from one to eight weeks in different experimental groups. Data represent means ± SEM, N = 10 per group. g, h The weight of the quadriceps and adductor muscle in the different groups at 8 week. Data represent means ± SEM, N = 10 per group. *: 0.01 < P < 0.05, **P < 0.01, when AAV-sgMstn2, RAAV-sgMstn2-treated were compared with AAV-CN-treated.

