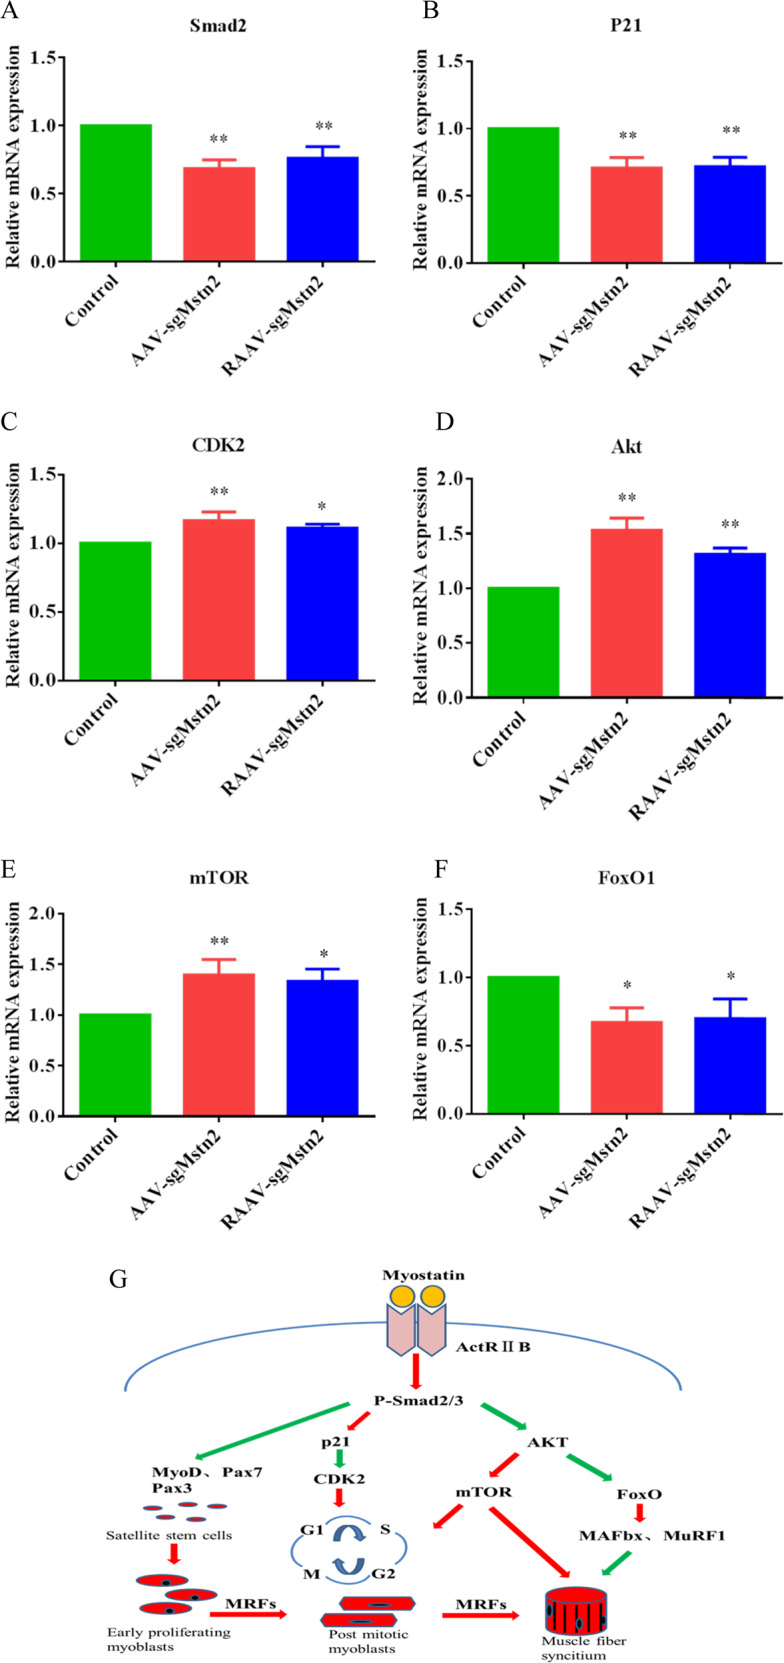
Fig. 4. The cytokines expression were changed by AAV-CN, AAV-sgMstn2, RAAV-sgMstn2 treatment in muscle tissues.

RT-PCR analysis was performed on 8 weeks on AAV-CN, AAV-sgMstn2, RAAV-sgMstn2-treated muscles in order to determine kinds of cytokines mRNA levels relative to GAPDH levels. Normalized data were used for generating the a Smad2, b p21, c CDK2, d AKT, e mTOR and f FoxO1 graphs depicted. Data represent means ± SEM (The number of samples was 3 per group, and each sample was repeated three times). *: 0.01 < P < 0.05, **P < 0.01 when AAV-sgMstn2, RAAV-sgMstn2-treated were compared with AAV-CN-treated. g A schematic were marked key cytokines of MSTN-related signaling pathway.
