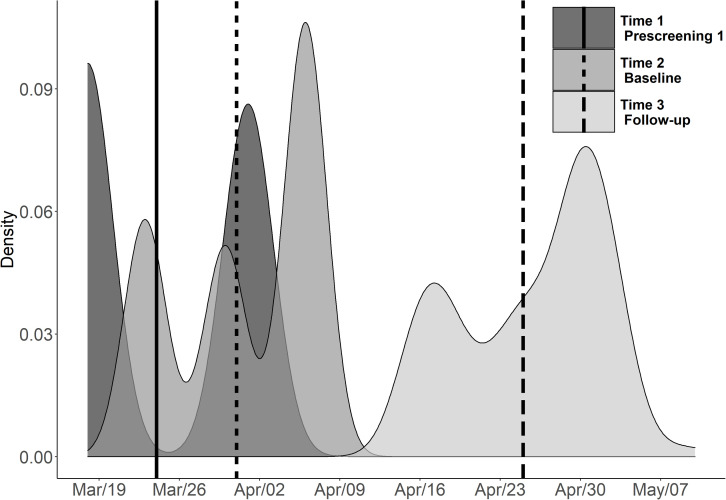
FIGURE 2.
Depiction of the average time point and density plots for the COVID-19 anxiety item responses grouped by assessment point in Spring 2020. The solid vertical line represents the average timepoint for the first assessment (Time 1/Prescreening 1), the dashed vertical line represents the average time point for the second assessment (Time 2/Baseline), and the vertical long dash line represents the average time point for the third assessment (Time 3/Follow-up). Note that the questionnaires tapping on personality were administered during the prescreening, whereas the WM assessment was carried out during the baseline assessment.

