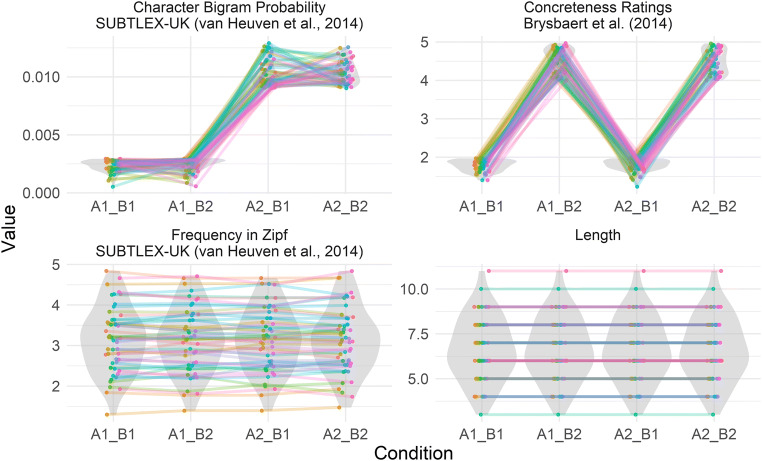
Fig. 2.
An example figure generated by the plot_design() function, for a stimulus list generated by the example code, consisting of 200 words split into four factorial cells: A1_B1 (low bigram probability, low concreteness), A1_B2 (low bigram probability, high concreteness), A2_B1 (high bigram probability, low concreteness), and A2_B2 (high bigram probability, high concreteness). In this example, words are controlled in terms of frequency (within ±0.2 Zipf), and length (exactly). When words are more closely matched on a variable, the distributions of control variables appear more similar, and the slopes of lines between matched items are less steep. The differences between conditions in character bigram probability and concreteness ratings (sought by the user) are reflected in the upper two plots

