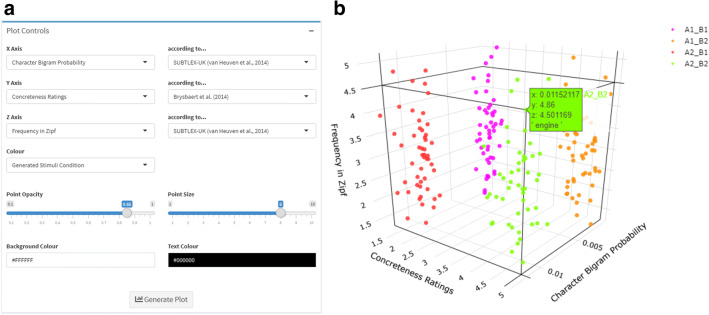
Fig. 4.
Example showing a user interface options and b resulting interactive plot produced by the Visualise tab, for stimuli generated by the “generate pipeline” specified by the code in the Example Applications section (2 × 2, character bigram probability by concreteness design, controlling for length and frequency). Each point corresponds to one word, which can be queried by the user by moving the cursor directly over that point. In the example, the user has queried a word from condition A2_B2, corresponding to the word, “engine”

