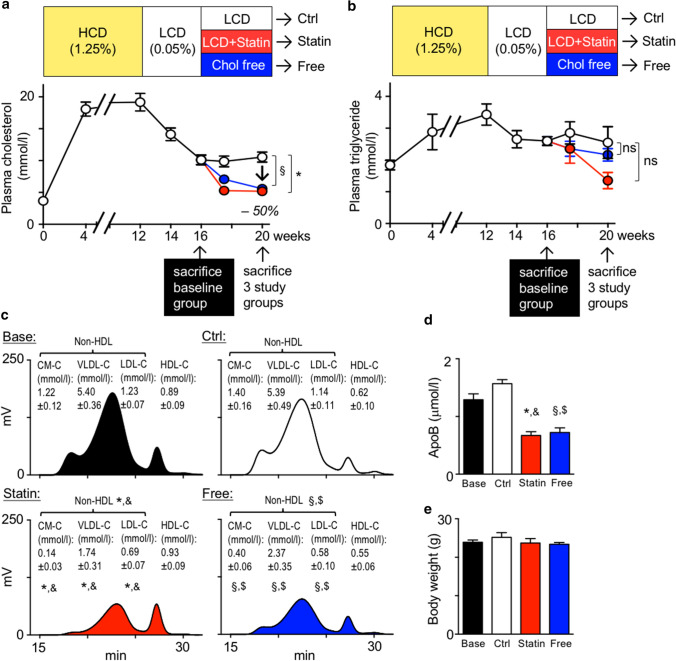
Fig. 1.
Experimental plaque regression study using atorvastatin and cholesterol-free diet. a, b Study design and diet scheme depicting plasma total cholesterol (a) and triglyceride (b) levels measured while feeding APOE*3-Leiden.CETP mice a high-cholesterol diet (HCD, 1.25% w/w cholesterol) for 12 weeks, followed by 4 weeks of low-cholesterol diet (LCD, 0.05% w/w cholesterol). At 16 weeks, the baseline group (Base) was sacrificed and the remaining mice were randomized to three study groups, continued LCD (control, Ctrl), LCD supplemented with 0.01% (w/w) atorvastatin (Statin), and a diet free of cholesterol (Free) for another 4 weeks. Data are presented as mean ± SEM. *,§ p < 0.05 denote statistically significant differences between the Control and Statin (*) or Control and Free (§) groups at the time of killing (week 20), n = 6 per group, one-way ANOVA. c Representative chromatograms and quantification of cholesterol in 4 major lipoprotein classes by gel-filtration HPLC. Data are presented as mean ± SEM. *,&,§,$ p < 0.05 denote statistically significant differences between the Base and Statin (&) or Base and Free ($) groups, and between Control and Statin (*) or Control and Free (§) groups at the time of sacrifice, n = 6 per group, one-way ANOVA. d ApoB plasma levels at the time of sacrifice. Results are presented as mean ± SEM, *,&,§,$ p < 0.05 denote statistically significant differences between the Base and Statin (&) or Base and Free ($) groups, and between Control and Statin (*) or Control and Free (§) groups at the time of sacrifice, n = 6 per group, one-way ANOVA. e Final body weight in all 4 groups at time of killing (Base n = 6, n = 8 other groups)

