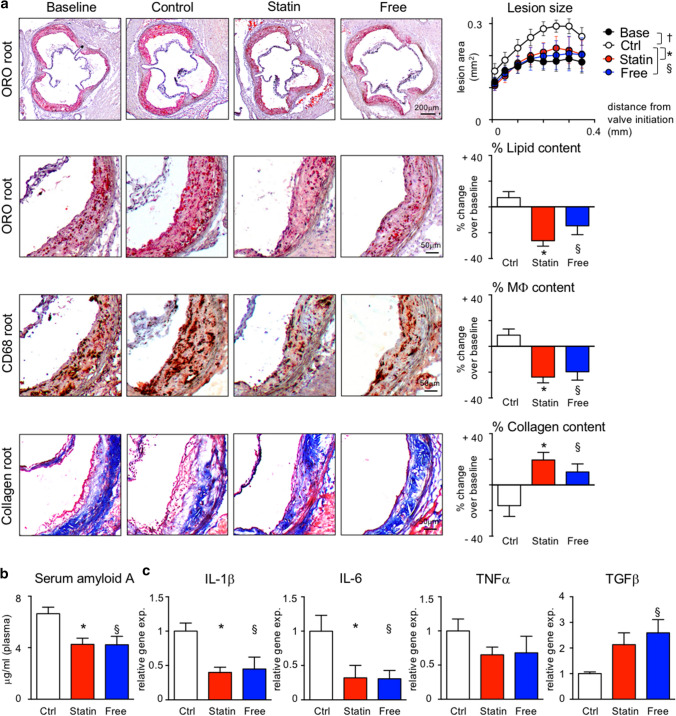
Fig. 2.
Serum cholesterol lowering leads to phenotypic plaque regression in APOE*3-Leiden.CETP mice. a Representative images of aortic root sections stained with Oil-red O (ORO), anti-CD68 (for macrophages, Mϕ) and Masson’s Trichrome (for collagen) on the left. On the right, lesion area was measured on 8 aortic root sections at 50 m intervals starting from valve initiation. Plaque composition was analyzed by quantifying the percent ORO+, CD68+ and collagen+ areas within lesions. Data are presented as mean ± SEM percent change over values in the baseline group to visualize relative changes during plaque progression and regression. *,§,† p < 0.05 denote statistically significant differences between the Ctrl and Base (†), Statin (*) and Free (§) groups, respectively, baseline n = 6, other 3 groups n = 8 per group, one-way ANOVA. (b) Serum amyloid A plasma levels at the time of sacrifice. Results are presented as mean ± SEM, *,§p < 0.05 denote statistically significant differences between the Ctrl and Statin (*) or Free (§) groups, n = 8 per group, one-way ANOVA. c Cytokine expression in atherosclerotic aortas. Results are presented as mean ± SEM fold change over control group values, *,§p < 0.05 denote statistically significant differences between the Ctrl and Statin (*) or Free (§) groups, n = 8 per group, one-way ANOVA

