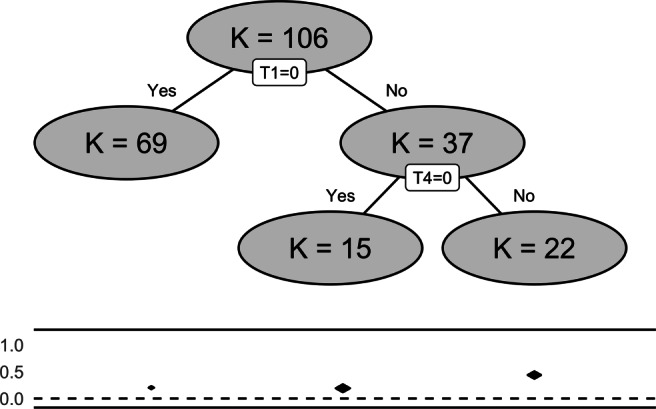
Fig. 3.

The meta-CART analysis result of 106 studies that examine the influence of motivation-enhancing BCTs on healthy eating and physical activities. The figure shows the FE meta-CART structure with splitting information at each internal node and the number of studies in each subgroup implied by a terminal node. The two solid lines show the range of the effect sizes of all the studies. The diamonds between the solid lines present the 95% confidence intervals of the summary effect sizes.
