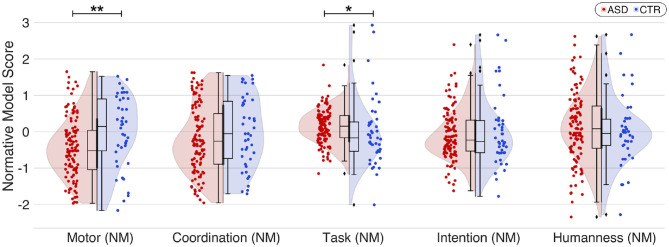
Figure 4.
Comparison between the two groups with ASD and typical development for different behavioral scores derived from the HDC protocol and corrected with normative modeling (NM). Only the motor score really discriminates between the two populations (d = −0.5; p < 0.005**), with significantly lower results among ASD. The lines represent linear regressions. Colored areas: 95% confidence intervals (CI). Neurotypical participants: blue; participants with ASD: red. *p < 0.05; **p < 0.005.

