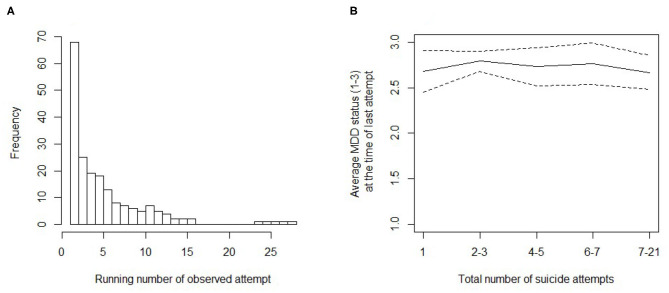
Figure 1.
Number of suicide attempts and status of major depressive episode (MDE). (A) Histogram of the lifetime running number of the attempt for each suicide attempt observed during the follow-up. (B) Average status of MDE (values: 1 = in remission, 2 = partial remission, and 3 = full MDE) at the time of the last attempt in patients with a different lifetime number of suicide attempts. The dashed lines give 95% Wald confidence intervals for the average (solid line).

