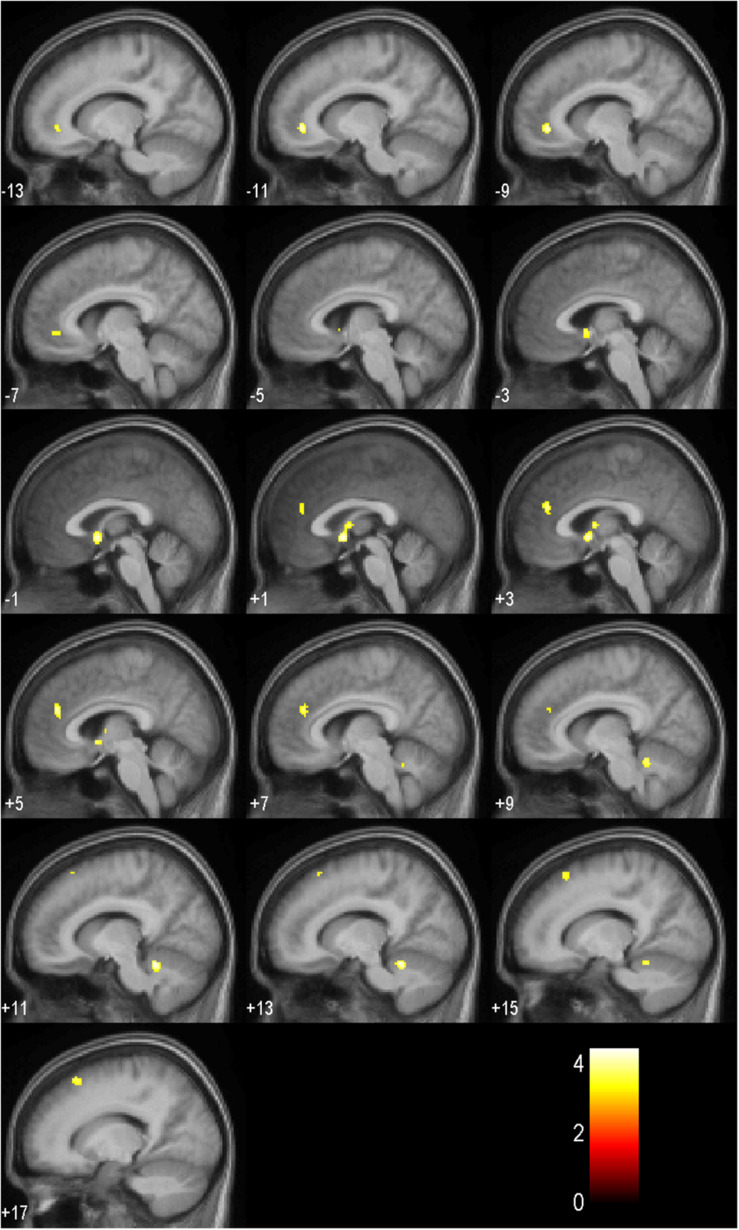
FIGURE 4.
Activation patterns in the anticipation period as listed in Table 6 for all symbols in comparison to the control symbol (p < 0.001, uncorrected; n = 17). Positive values represent the number of sagittal slices from the center to the right hemisphere. Negative values indicate the number of sagittal slices from the center to the left hemisphere. The colored bar specifies the respective t-value’s magnitude.

