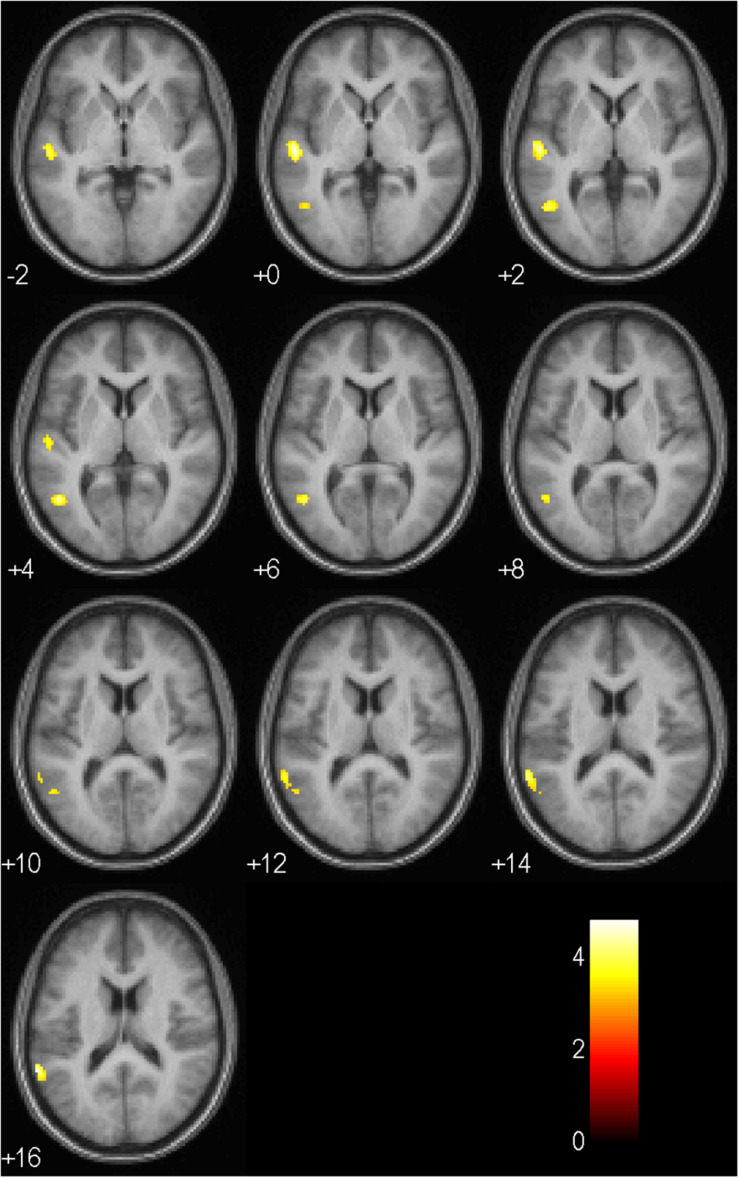
FIGURE 5.
Activation patterns in the anticipation period as listed in Table 6 for negative balanced in comparison to positive balanced symbols (main effect balance, no > yes; p < 0.001, uncorrected; n = 17). Positive values represent the number of axial slices from the center downwards. Negative values indicate the number of sagittal slices from the center upwards. The colored bar specifies the respective t-value’s magnitude.

