Figure 3.
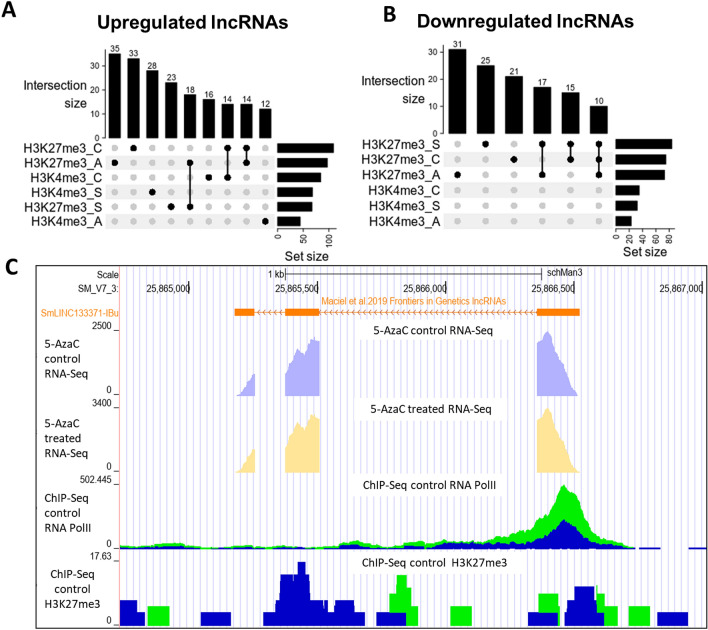
Hundreds of lncRNAs differentially expressed after 5-AzaC exposure in S. mansoni females have histone transcriptional activating or repressive marks at their TSSs. The UpSet intersection diagram shows the number of S. mansoni lncRNAs differentially expressed after 5-AzaC exposure (y-axis) that have been detected in each of the intersection sets, indicated by the connected points in the lower part of the plot, as having the H3K4me3 transcriptional activating marks and/or the H3K27me3 repressive marks within 1 kb (upstream or downstream) from their TSSs. Six histone mark datasets indicated at the bottom left were analyzed: H3K4me3_A in adults, H3K4me3_C in cercariae, H3K4me3_S in schistosomula, H3K27me3_A in adults, H3K27me3_S in schistosomula, and H3K27me3_C in cercariae, and each set size horizontal black bar represents the number of lncRNAs that contain the indicated histone mark at the indicated stage. The top enriched intersection sets are shown for the 5-AzaC upregulated (A) and downregulated (B) lncRNAs; all intersection sets and the lists of lncRNAs in each intersection set are shown in Supplementary Table S5, S6. (C) Snapshot of a S. mansoni genome browser image (www.schistosoma.usp.br), showing a region spanning 3 kb on chromosome 3, where the SmLINC133371-IBu is located. The orange track (top) represents lncRNAs from S. mansoni published by Maciel et al.31. Below the orange lncRNAs track, two other tracks show RNA-Seq data from control (light purple) or 5-AzaC treated S. mansoni females (light yellow). Below, two ChIP-Seq tracks are shown: RNA Polymerase II ChIP-Seq (ChIP-Seq Control RNA Pol II) and H3K27me3 histone mark ChIP-Seq (ChIP-Seq Control H3K27me3). The green and blue colours at the two ChIP-Seq tracks at the bottom represent each of two experimental biological replicates.

