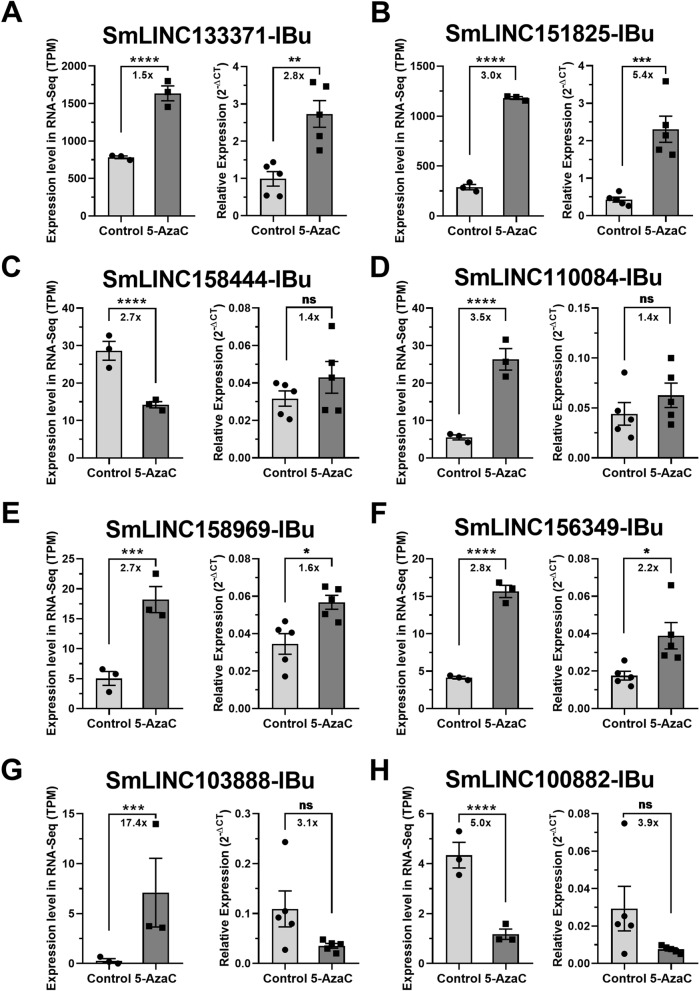
Figure 4.
Expression profiles in S. mansoni females of selected lincRNAs differentially expressed after 5-AzaC treatment (491 µM). Eight lincRNAs were selected after re-analysis of RNA-Seq public datasets of 5-AzaC treated S. mansoni females16 for validation by RT-qPCR in females. For each of the eight selected lincRNAs, the expression profiles obtained with RNA-Seq are shown on the left as TPM (transcripts per million), whereas the RT-qPCR results are shown on the right: (A) SmLINC133371-IBu; (B) SmLINC151825-IBu; (C) SmLINC158444-IBu; (D) SmLINC110084-IBu; (E) SmLINC158969-IBu; (F) SmLINC156349-IBu; (G) SmLINC103888-IBu; (H) SmLINC100882-IBu. For the RNA-Seq data, three biological replicates were analyzed; the fold-changes and p values represented by asterisks that are shown in the brackets were obtained using DESeq2. For the RT-qPCR data, mean ± SEM from five biological replicates are shown, and Student unpaired two-sided t test was applied. *p < 0.05, **p < 0.01, ***p < 0.001, ****p < 0.0001; ns: not significant.

